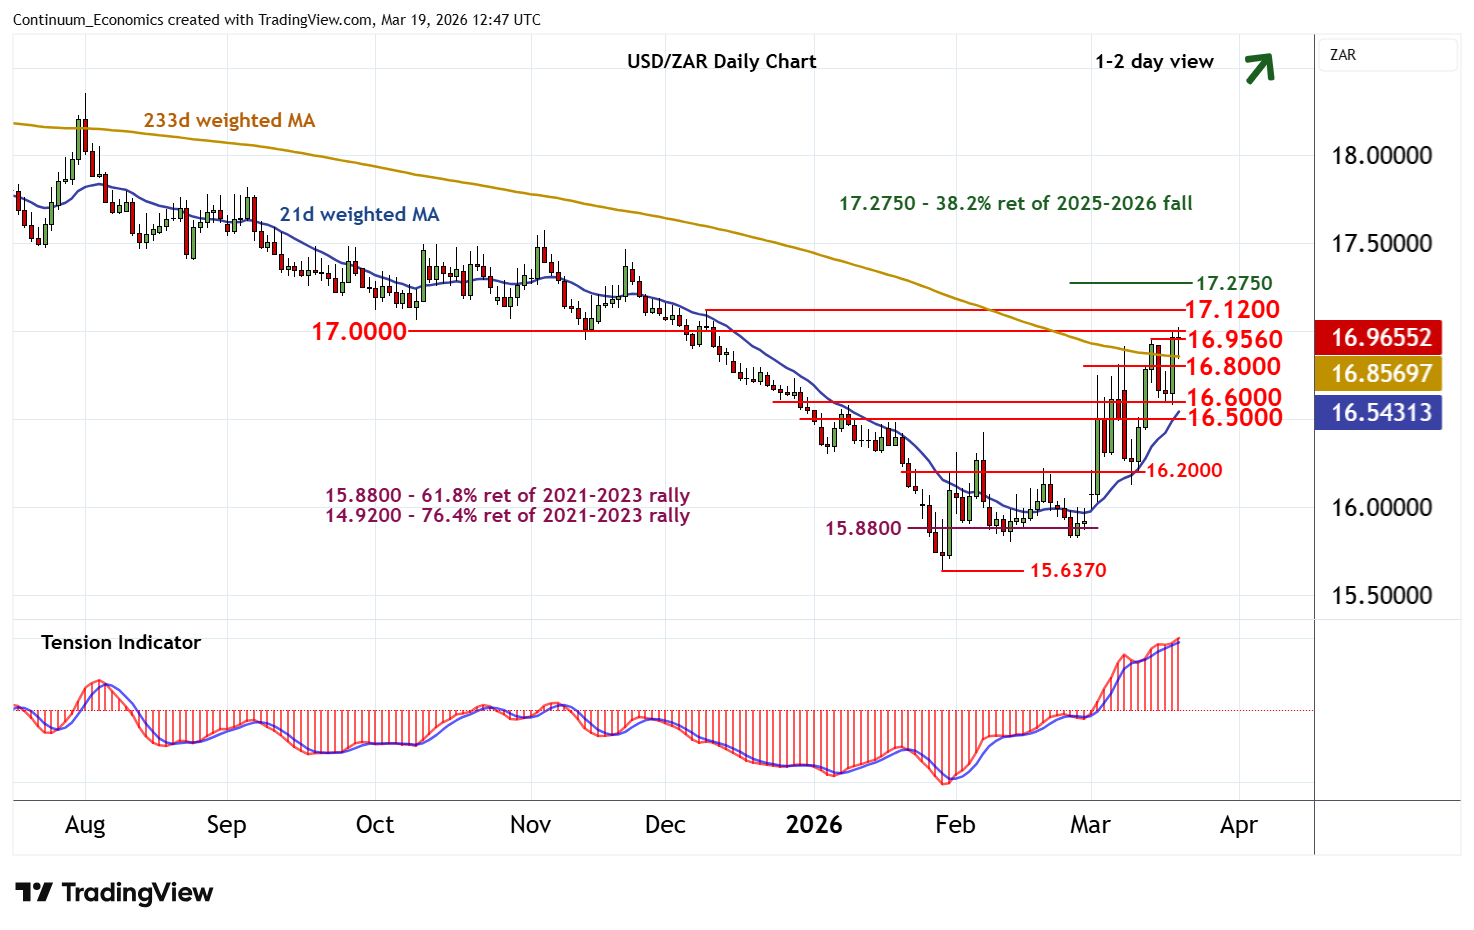
Chart USD/ZAR Update: Pushing higher
Anticipated gains have reached resistance within the 16.9560 current year high of 13 March and congestion around 17.000
| Level | Comment | Level | Comment | |||||
|---|---|---|---|---|---|---|---|---|
| R4 | 17.2750 | ** | 38.2% ret of 2025-2026 fall | S1 | 16.8000 | congestion | ||
| R3 | 17.1200 | * | 9 Dec (w) high | S2 | 16.6000 | break level | ||
| R2 | 17.0000 | * | congestion | S3 | 16.5000 | break level | ||
| R1 | 16.9560 | 13 Mar YTD high | S4 | 16.2000 | * | congestion |
Asterisk denotes strength of level
12:10 GMT - Anticipated gains have reached resistance within the 16.9560 current year high of 13 March and congestion around 17.000, where overbought intraday studies are prompting choppy trade. Daily readings are improving and broader weekly charts are positive, highlighting room for further gains in the coming sessions. However, a close above this range is needed to turn sentiment positive and extend late-January gains towards the 17.2750 Fibonacci retracement. Meanwhile, support is raised to congestion around 16.8000. A break beneath here, if seen, should give way to consolidation above 16.5000 - 16.6000.