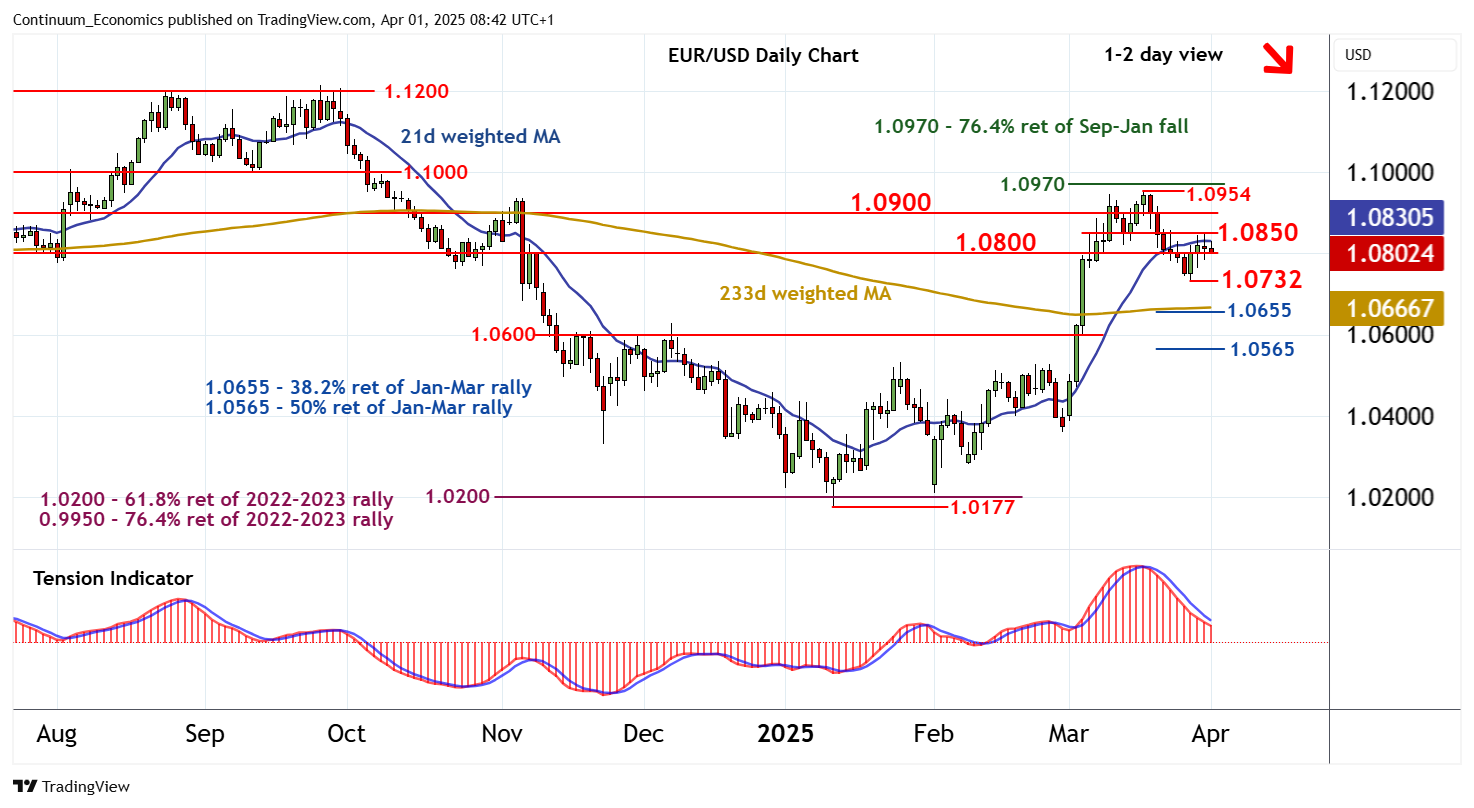
Chart EUR/USD Update: Leaning lower in range

Little change, as prices extend cautious trade within the tight 1.0800 - 1.0850 range

| Levels | Imp | Comment | Levels | Imp | Comment | |||
|---|---|---|---|---|---|---|---|---|
| R4 | 1.0970 | ** | 76.4% ret of Sep-Jan fall | S1 | 1.0800 | * | break level | |
| 14 | 1.0954 | 18 Mar YTD high | S2 | 1.0732 | * | 27 Mar (w) low | ||
| R2 | 1.0900 | * | break level | S3 | 1.0655 | ** | 38.2% ret of Jan-Mar rally | |
| R1 | 1.0850 | break level | S4 | 1.0600 | ** | congestion |
Asterisk denotes strength of level
08:30 BST - Little change, as prices extend cautious trade within the tight 1.0800 - 1.0850 range. Intraday studies have turned mixed/negative and rising oversold daily stochastics are flattening, suggesting a deterioration in sentiment and room for fresh losses in the coming sessions. The daily Tension Indicator is also negative, suggesting room for a later break below 1.0800. Focus will then turn to the 1.0732 weekly low of 27 March, where mixed/positive weekly charts could prompt fresh consolidation. A close beneath here, however, will add weight to sentiment and extend March losses towards the 1.0655 Fibonacci retracement. Meanwhile, any tests above resistance at the 1.0850 break level should fade towards 1.0900.