Published: 2026-05-13T12:09:41.000Z
Chart USD/RUB Update: Fresh year lows - prices under pressure
3
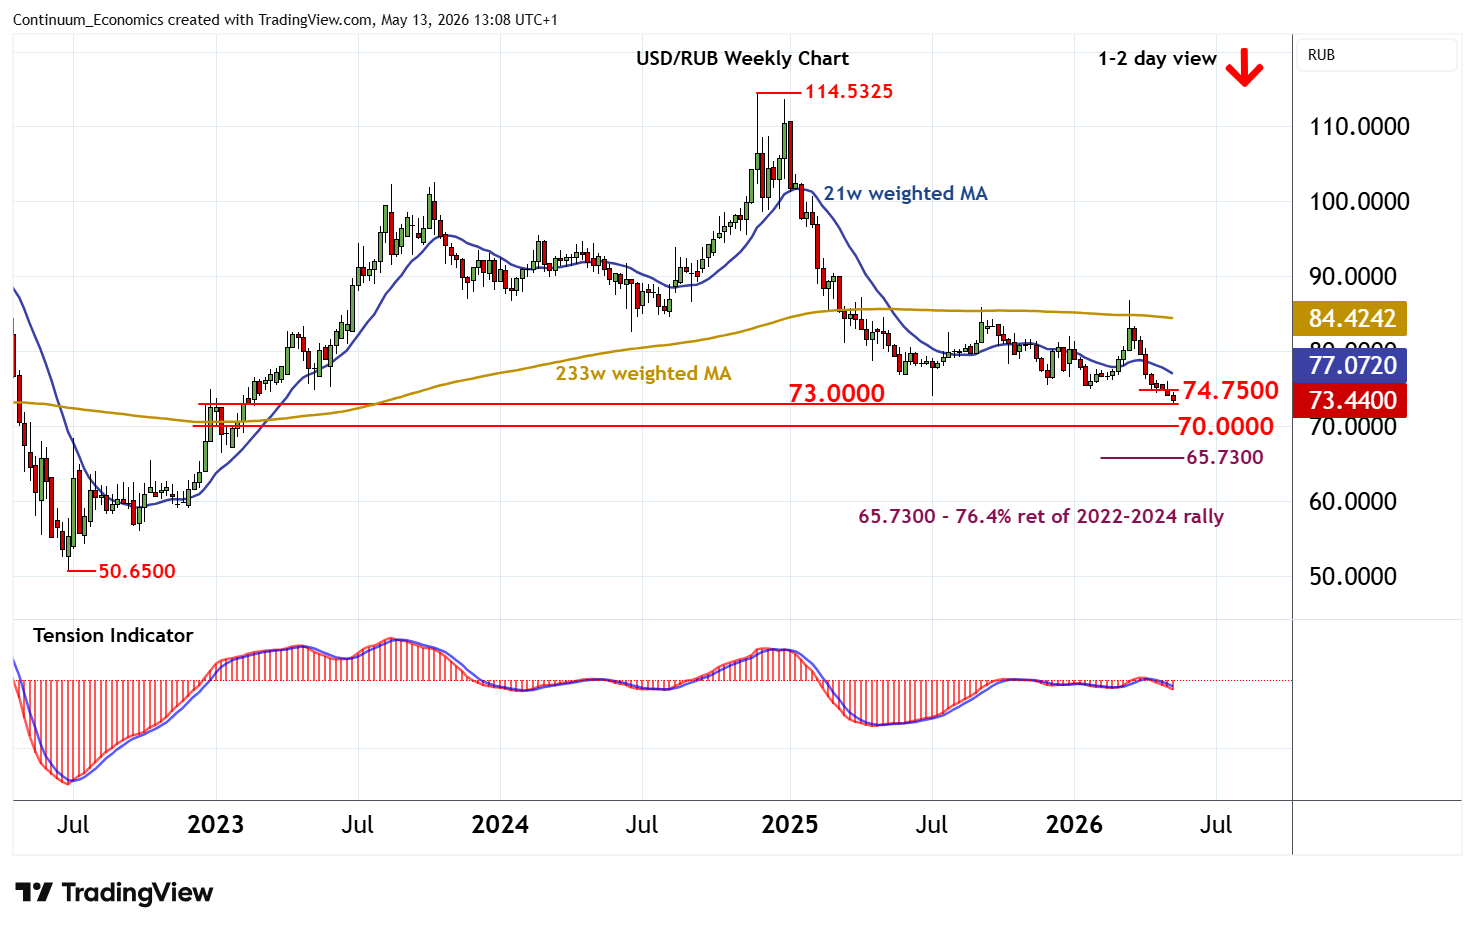
Anticipated losses have posted a fresh year low around 73.0850
| Levels | Comment | Levels | Comment | |||||
| R4 | 77.0000 | ** | congestion | S1 | 73.0000 | * | historic break level | |
| R3 | 76.6350 | * | 16 Apr high | S2 | 72.6800 | * | late-Feb 2023 (w) low | |
| R2 | 76.0000 | * | congestion | S3 | 70.0000 | ** | congestion | |
| R1 | 74.5000 | * | break level | S4 | 69.0200 | * | February 2023 low |
Asterisk denotes strength of level
12:50 BST - Anticipated losses have posted a fresh year low around 73.0850. However, daily readings are under pressure and broader weekly charts are also falling, highlighting room for still further losses in the coming sessions. A break beneath here will extend November 2024 losses to the 73.0000 break level from December 2022 - February 2023, with potential for continuation below the 72.6800 late-February 2023 low towards congestion around 70.0000. Meanwhile, resistance is at the 74.5000 break level. A close above here, if seen, would help to stabilise sentiment and prompt consolidation beneath congestion around 76.0000.