Published: 2026-02-25T12:50:49.000Z
Chart USD/ZAR Update: Lower in range
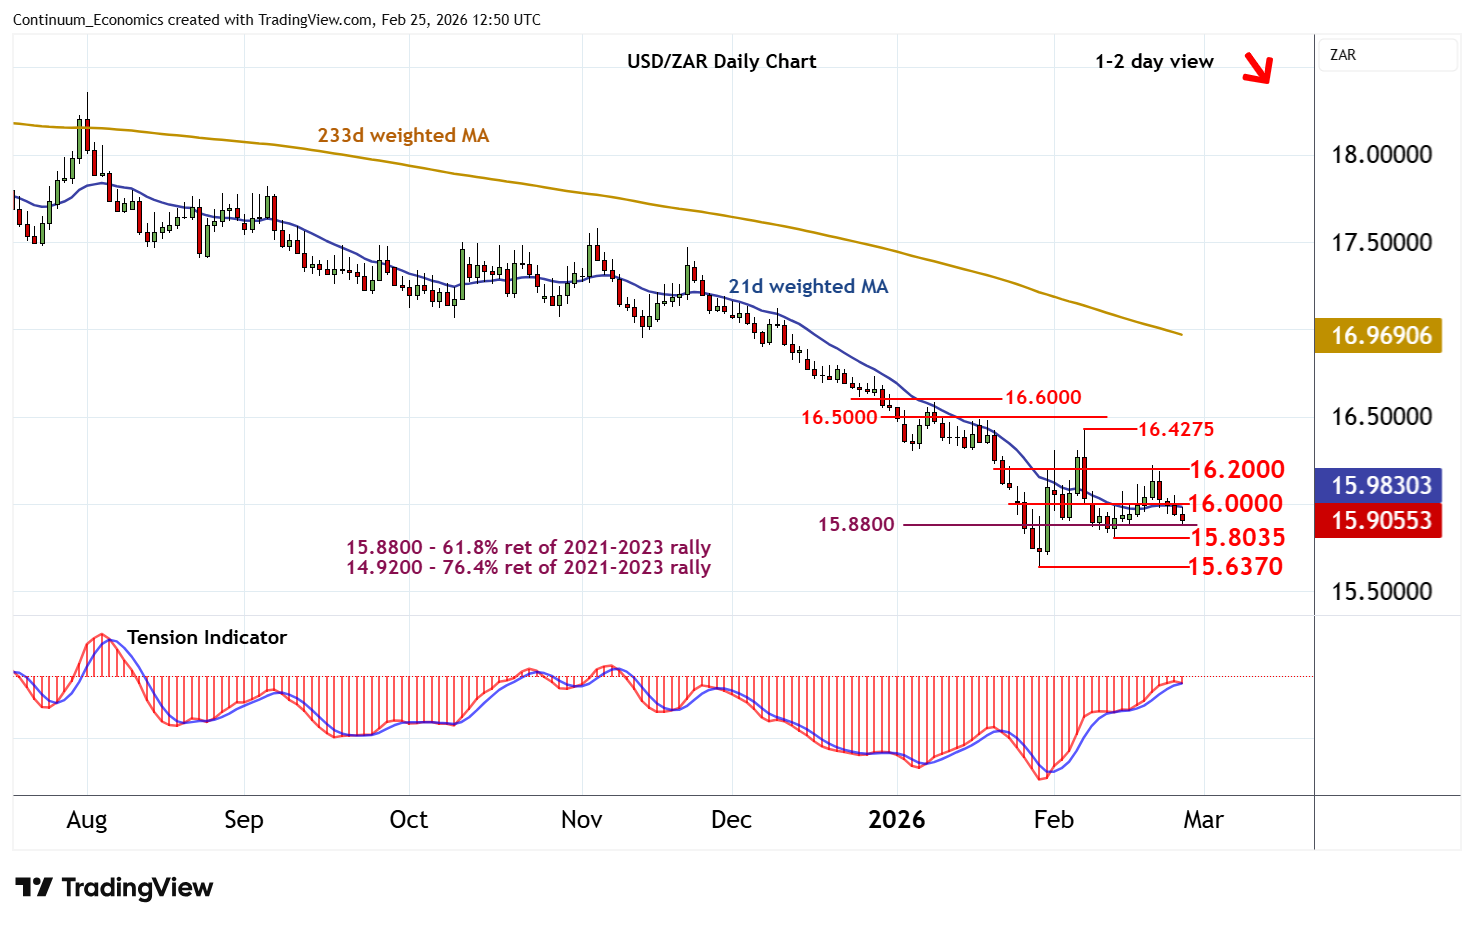
1
Cautious trade is giving way to anticipated losses
| Level | Comment | Level | Comment | |||||
|---|---|---|---|---|---|---|---|---|
| R4 | 16.5000 | break level | S1 | 15.8035 | * | 12 Feb (w) low | ||
| R3 | 16.4275 | * | 6 Feb (w) high | S2 | 15.6370 | ** | 29 Jan YTD low | |
| R2 | 16.2000 | minor congestion | S3 | 15.1665 | * | June 2022 low | ||
| R1 | 16.0000 | ** | congestion | S4 | 15.0000 | ** | congestion |
Asterisk denotes strength of level
12:25 GMT - Cautious trade is giving way to anticipated losses, as intraday studies turn down, with prices currently trading around 15.9000. Daily readings are also turning down, highlighting room for a test of support at the 15.8035 weekly low of 12 February. But rising oversold weekly stochastics should limit any initial tests in consolidation, before bearish longer-term charts prompt a break towards critical support at the 15.6370 current year low of 29 January.. Meanwhile, resistance is lowered to congestion around 16.0000. A close above here, if seen, will stabilise price action and prompt consolidation beneath further congestion around 16.2000.