Published: 2026-02-18T09:25:12.000Z
Chart USD/JPY Update: Higher in range, but gains to remain limited
1
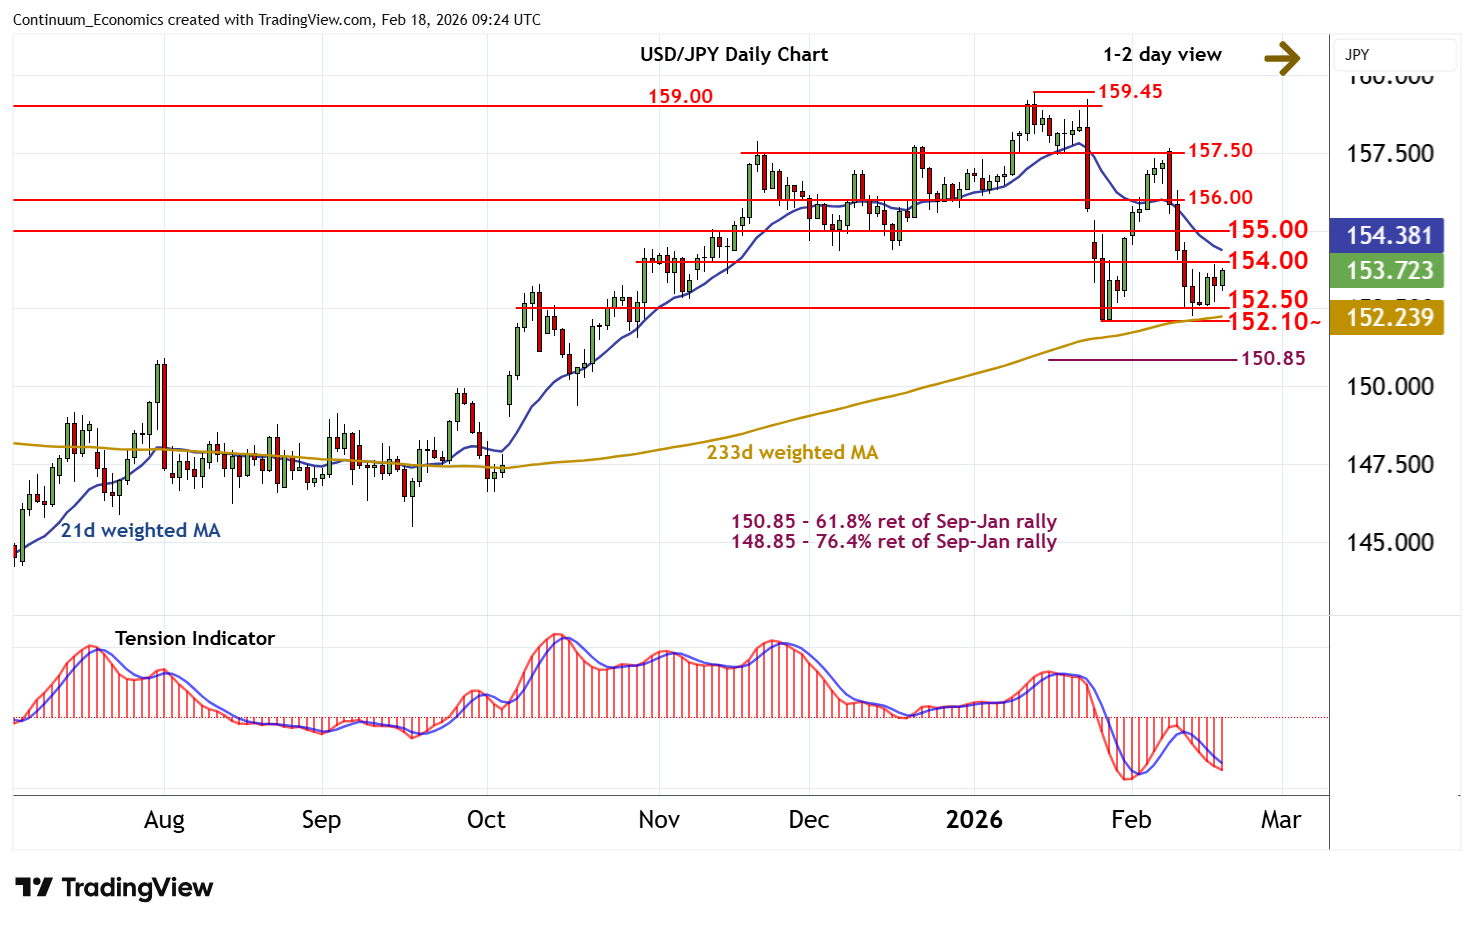
Anticipated tests lower have not been seen
| Levels | Imp | Comment | Levels | Imp | Comment | |||
|---|---|---|---|---|---|---|---|---|
| R4 | 157.50 | * | congestion | S1 | 152.50 | * | congestion | |
| R3 | 156.00 | * | congestion | S2 | 152.10~ | ** | 27 Jan YTD low | |
| R2 | 155.00 | * | break level | S3 | 150.85 | ** | 61.8% ret of Sep-Jan rally | |
| R1 | 154.00 | * | congestion | S4 | 150.00 | ** | break level |
Asterisk denotes strength of level
09:00 GMT - Anticipated tests lower have not been seen, as consolidation gives way to a push higher in USD-driven trade. Rising intraday studies and a tick higher in daily stochastics highlight room for a test of congestion resistance at 154.00. But the negative daily Tension Indicator and mixed/negative weekly charts should limit any break in renewed selling interest beneath resistance at 155.00. Meanwhile, support remains at congestion around 152.50 and extends to the 152.10~ current year low of 27 January. A later close beneath here will add weight to sentiment and confirm continuation of mid-January losses, as the 150.85 Fibonacci retracement then attracts.