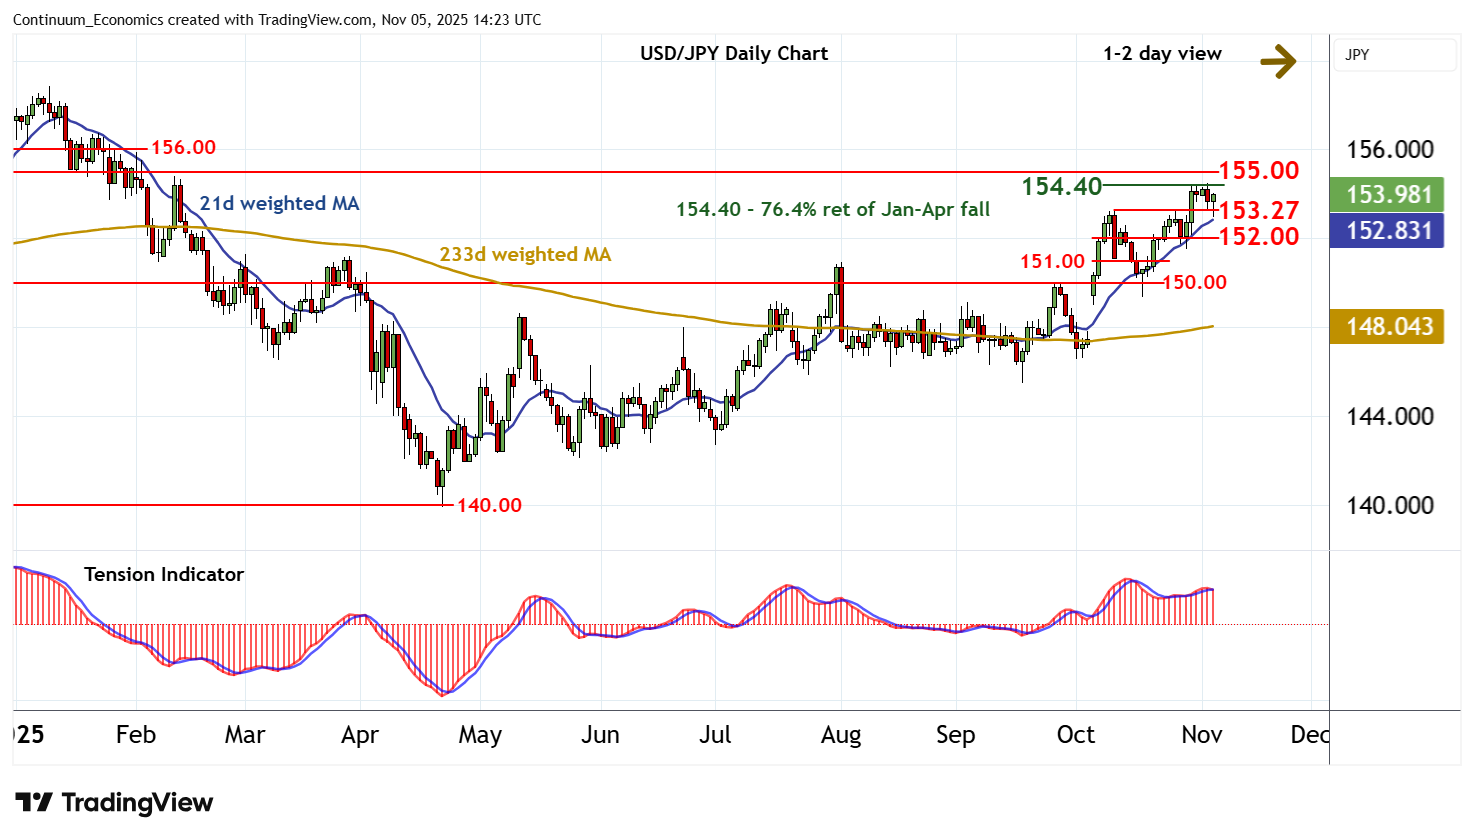
Chart USD/JPY Update: Choppy beneath the 154.40 Fibonacci retracement
The anticipated test below support at the 153.27 weekly high of 10 October has bounced from 152.95
| Levels | Imp | Comment | Levels | Imp | Comment | |||
|---|---|---|---|---|---|---|---|---|
| R4 | 157.00 | * | congestion | S1 | 153.27 | ** | 10 Oct (w) high | |
| R3 | 155.88/00 | * | February high; congestion | S2 | 152.00 | congestion | ||
| R2 | 155.00 | * | congestion | S3 | 151.00 | break level | ||
| R1 | 154.40 | ** | 76.4% ret of Jan-Apr fall | S4 | 150.00 | ** | congestion |
Asterisk denotes strength of level
14:10 GMT - The anticipated test below support at the 153.27 weekly high of 10 October has bounced from 152.95, as oversold intraday studies unwind, with steady gains currently pressuring 154.00. Above here is strong resistance at the 154.40 Fibonacci retracement. But daily readings remain under pressure, highlighting any initial tests could give way to fresh consolidation. Broader weekly charts continue to rise, but a close above 154.40 is needed to improve sentiment and extend April gains towards congestion around 155.00. Beyond here is the 155.88 high of February and congestion around 156.00. Meanwhile, any fresh tests below 153.27 should meet renewed buying interest above congestion support at 152.00.