Published: 2025-06-17T02:49:54.000Z
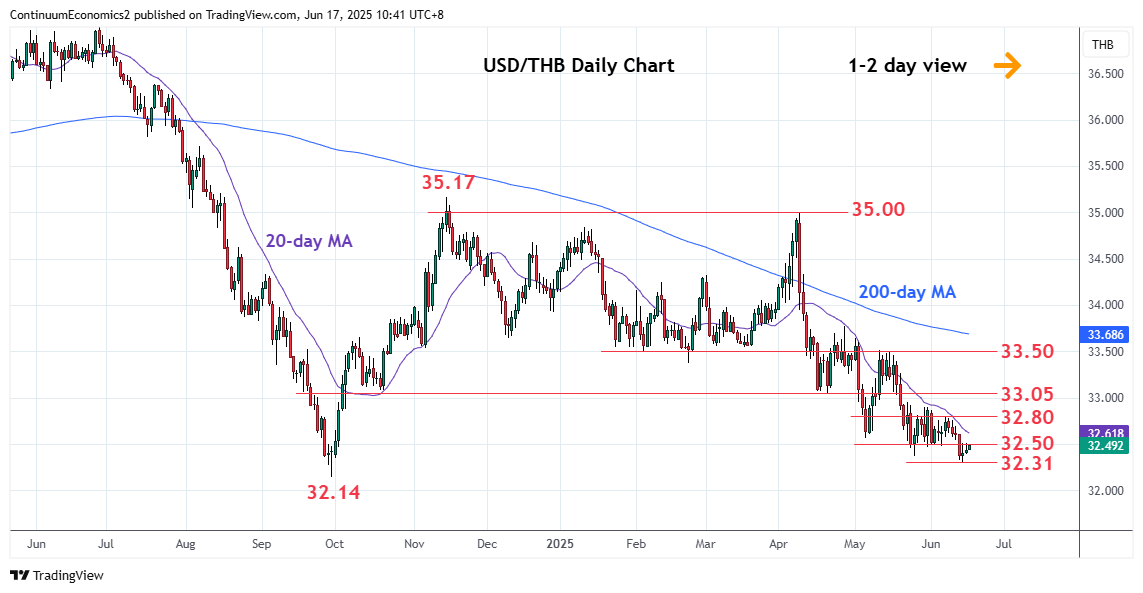
Chart USD/THB Update: Consolidating

Technical Analyst
2
Higher in consolidation from the 32.31 Friday's current year low as prices unwind oversold intraday and daily studies
| Level | Comment | Level | Comment | |||||
|---|---|---|---|---|---|---|---|---|
| R4 | 33.25 | * | congestion | S1 | 32.31 | ** | 13 Jun YTD low | |
| R3 | 33.00/05 | * | congestion, Apr low | S2 | 32.14 | ** | Sep 2024 year low | |
| R2 | 32.80/90 | ** | congestion, 29 May high | S3 | 32.08 | ** | Feb 2022 year low | |
| R1 | 32.50/56 | * | congestion, 6 May low | S4 | 32.00 | * | congestion |
Asterisk denotes strength of level
02:45 GMT - Higher in consolidation from the 32.31 Friday's current year low as prices unwind oversold intraday and daily studies. Resistance starts at the 32.50/32.56 congestion and 6 May low and lift over this needed to ease the bearish pressure and open up room for stronger corrective bounce to 32.80/32.90 resistance. Correction is expected to give way to renewed selling pressure later and break of 32.3732.31 lows will extend the broader losses from the November high at 35.17 to retest 32.14, September 2024 year low. Below this, will turn focus to the 32.08, 2022 year low.