Published: 2026-04-28T16:03:59.000Z
Chart USD/CAD Update: Limited tests higher
1
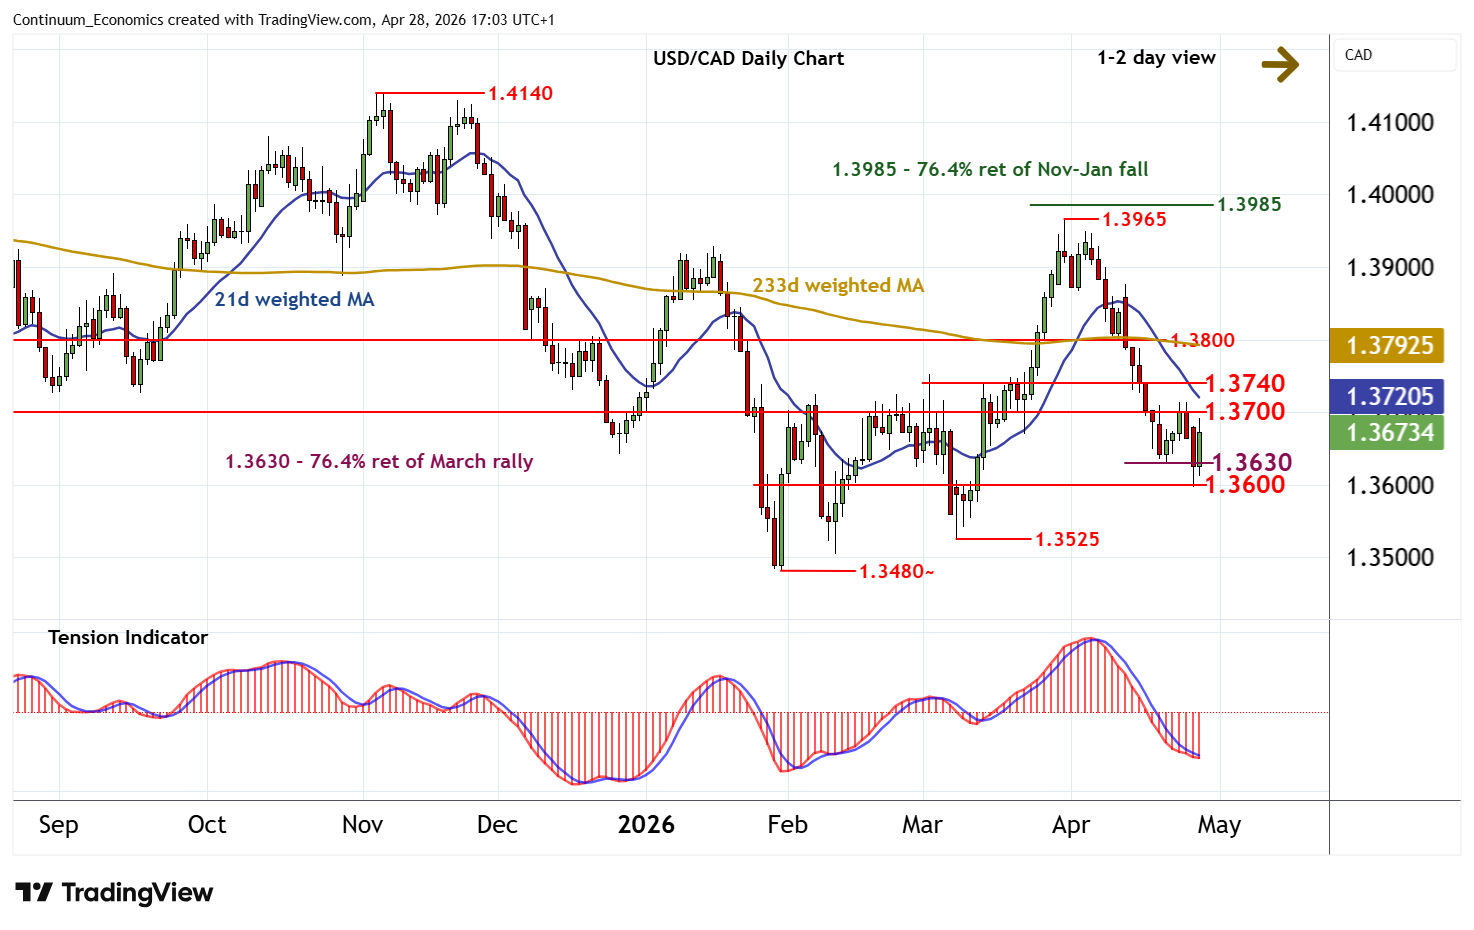
The test of support within the broad 1.3600 - 1.3630 range is giving way to a steady intraday bounce
| Levels | Imp | Comment | Levels | Imp | Comment | |||
|---|---|---|---|---|---|---|---|---|
| R4 | 1.3850 | * | congestion | S1 | 1.3630 | ** | 76.4% ret of March rally | |
| R3 | 1.3800 | * | congestion | S2 | 1.3600 | ** | congestion | |
| R2 | 1.3740 | * | break level | S3 | 1.3525 | * | 9 Mar (m) low | |
| R1 | 1.3700 | ** | congestion | S4 | 1.3480~ | ** | 30 Jan YTD low |
Asterisk denotes strength of level
16:35 BST - The test of support within the broad 1.3600 - 1.3630 range is giving way to a steady intraday bounce, with prices currently trading around 1.3670. A tick higher in oversold daily stochastics suggests room for a test of here. But the bearish daily Tension Indicator and negative weekly charts should limit any break in renewed selling interest towards 1.3740. Following cautious/corrective trade, fresh losses are looked for. A later close below congestion support at 1.3600 will add weight to sentiment and extend late-March losses towards the 1.3525 monthly low of 9 March.