Published: 2025-04-10T16:27:39.000Z
Chart USD/MXN Update: Choppy trade

Senior Technical Strategist
-
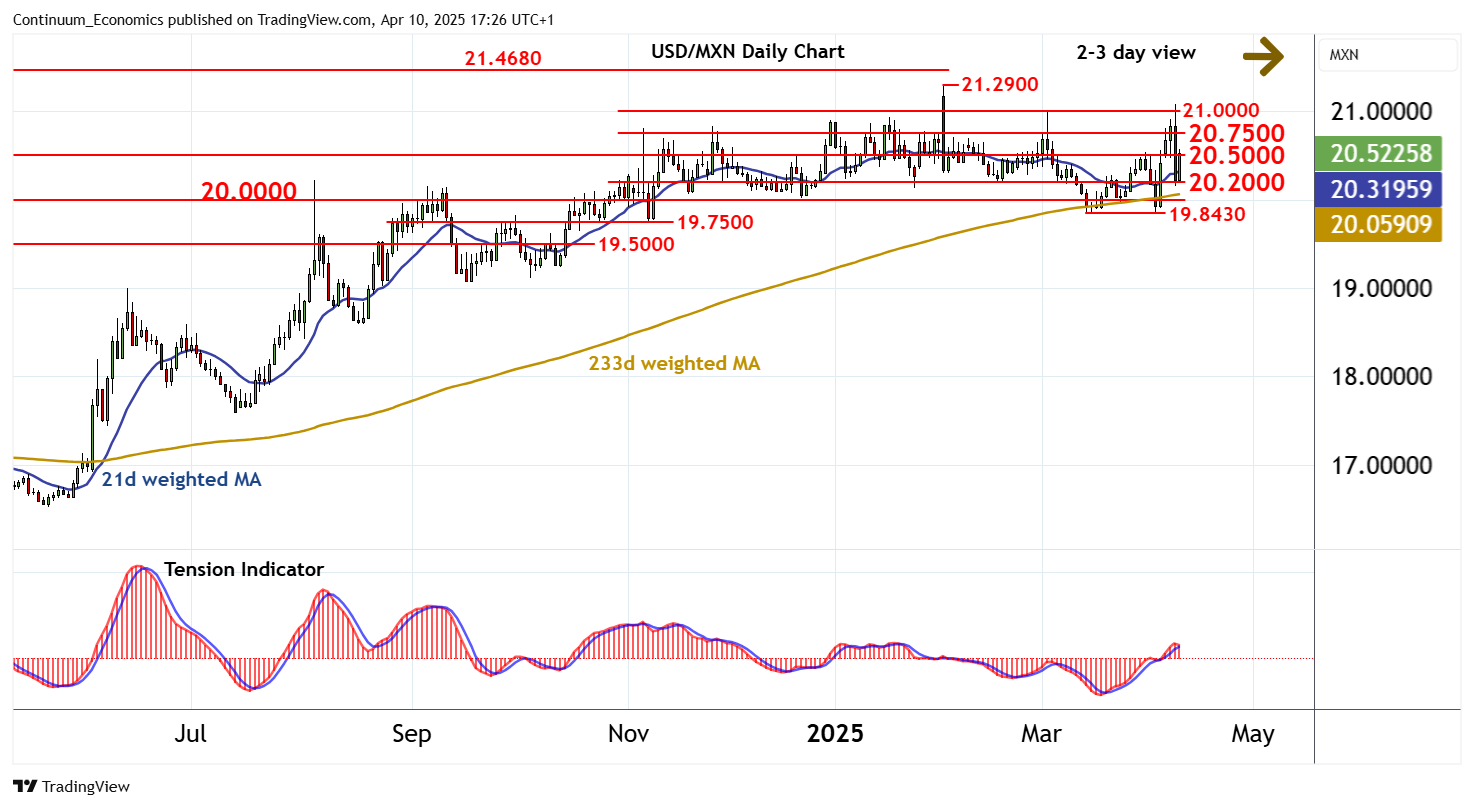
The test above resistance at 21.0000 has been sharply rejected
| Levels | Imp | Comment | Levels | Imp | Comment | |||
|---|---|---|---|---|---|---|---|---|
| R4 | 21.0780 | 9 Apr high | S1 | 20.2000 | break level | |||
| R3 | 21.0000 | ** | 4 Mar (m) high | S2 | 20.0000 | * | congestion | |
| R2 | 20.7500 | ** | congestion | S3 | 19.8430 | ** | 14 Mar YTD low | |
| R1 | 20.5000 | * | congestion | S4 | 19.7500 | * | break level |
Asterisk denotes strength of level
17:00 BST - The test above resistance at 21.0000 has been sharply rejected, with prices falling to support at 20.2000 where fresh buying interest is appearing. Prices are pressuring congestion resistance at 20.5000, but deteriorating daily readings and mixed weekly charts are expected to limit any initial break in fresh consolidation beneath congestion around 20.7500. Meanwhile, a break below 20.2000 will add weight to sentiment and open up congestion around 20.0000. But a close below the 19.8430 current year low of 14 March is needed to turn sentiment negative and confirm continuation of February losses.