Published: 2025-12-05T00:23:57.000Z
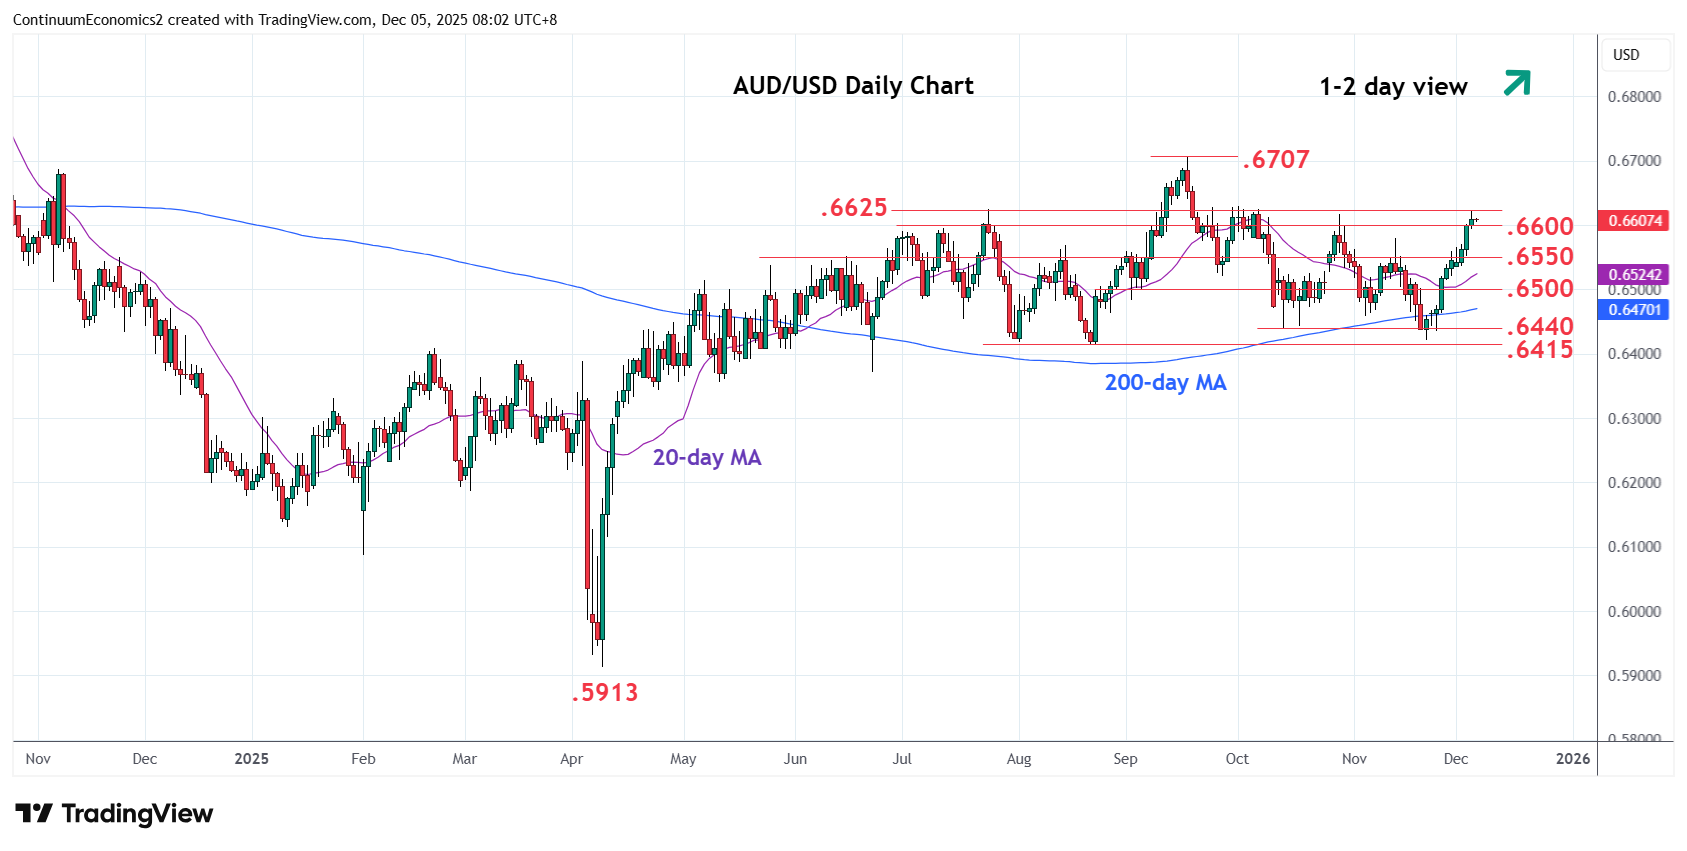
Chart AUD/USD Update: Consolidating test of .6600/25 resistance
1
Settled back from test of strong resistance at the .6600/25 area as prices consolidate gains from the .6421, November low
| Levels | Imp | Comment | Levels | Imp | Comment | |||
|---|---|---|---|---|---|---|---|---|
| R4 | 0.6750 | * | congestion | S1 | 0.6580 | * | Nov high | |
| R3 | 0.6700/07 | ** | figure, 17 Sep YTD high | S2 | 0.6550 | * | congestion | |
| R2 | 0.6660 | * | 18 Sep high | S3 | 0.6500 | * | congestion | |
| R1 | 0.6600/25 | ** | congestion, Jul high | S4 | 0.6440/15 | ** | Oct, Aug lows |
Asterisk denotes strength of level
00:15 GMT - Settled back from test of strong resistance at the .6600/25 area as prices consolidate gains from the .6421, November low. Pause here see prices unwinding overbought intraday and daily studies but a later is expected to open up room for retest of the .6707, September current year high. Clearance here here will extend the broader gains from the April low to retrace losses from the September 2024 high. Meanwhile, support is raised to the .6580 November which extend to the .6550 congestion. This area is expected to underpin and sustain gains from the November low.