Published: 2025-07-10T10:40:49.000Z
Chart USD/ZAR Update: Choppy trade turning lower

Senior Technical Strategist
1
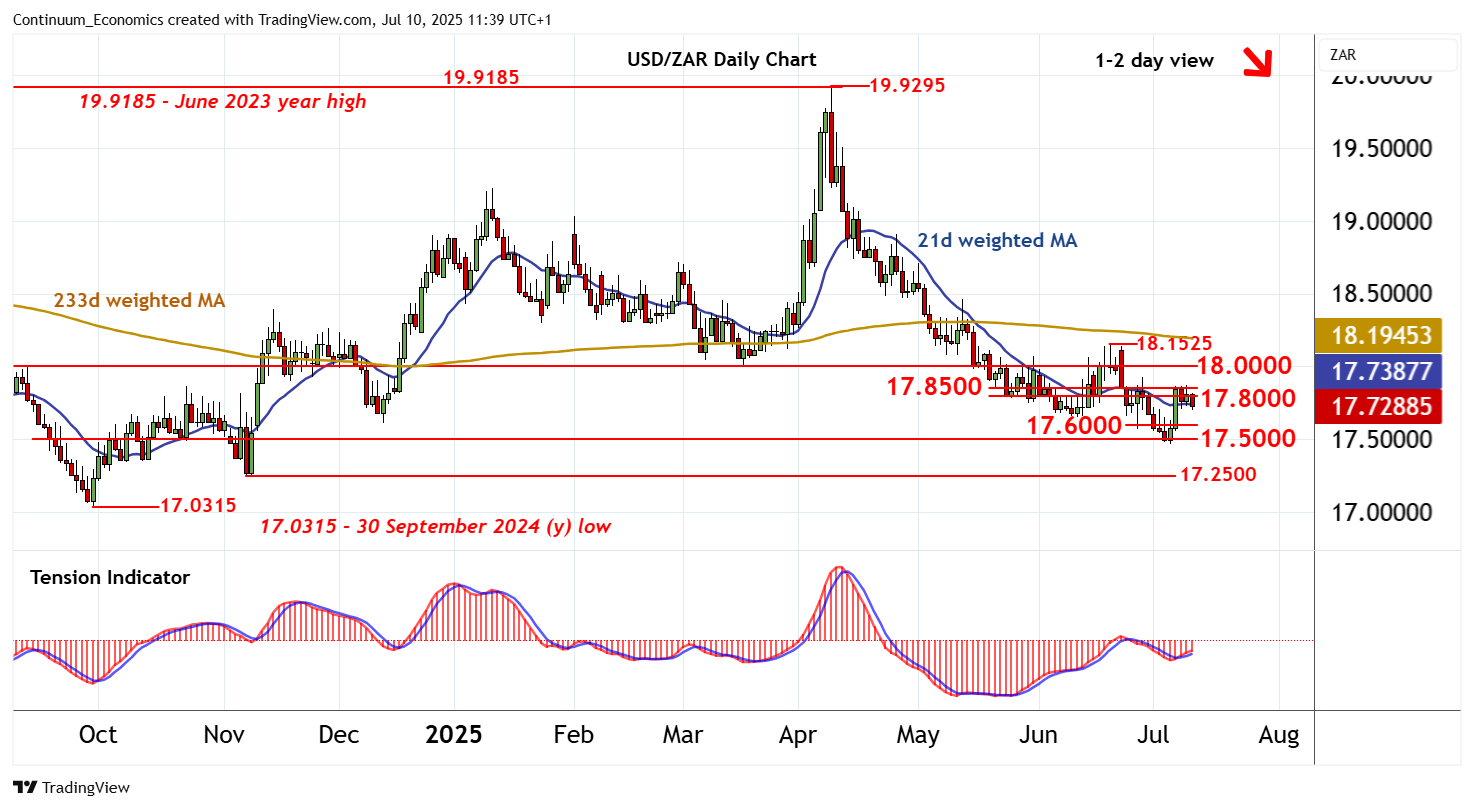
Choppy trade within resistance at 17.8000-17.8500 has failed to extend higher
| Level | Comment | Level | Comment | |||||
|---|---|---|---|---|---|---|---|---|
| R4 | 18.1525 | ** | 19 Jun (m) high | S1 | 17.6000 | * | congestion | |
| R3 | 18.0000 | ** | congestion | S2 | 17.5000 | * | congestion | |
| R2 | 17.8500 | break level | S3 | 17.4680~ | current year low | |||
| R1 | 17.8000 | * | congestion | S4 | 17.2500 | * | 7 Nov (m) low |
Asterisk denotes strength of level
11:30 BST - Choppy trade within resistance at 17.8000-17.8500 has failed to extend higher, as intraday studies turn down and overbought daily stochastics flatten. Selling interest has reached 17.7250. But the rising daily Tension Indicator is expected to limit initial scope in consolidation above congestion support at 17.6000, before negative weekly charts prompt further weakness. Meanwhile, a break above 17.8500, looking increasingly unlikely, will open up congestion resistance at 18.0000, where fresh selling interest is expected to appear.