Published: 2025-02-27T15:03:21.000Z
Chart AUD/USD Update: Under pressure

Senior Technical Strategist
-
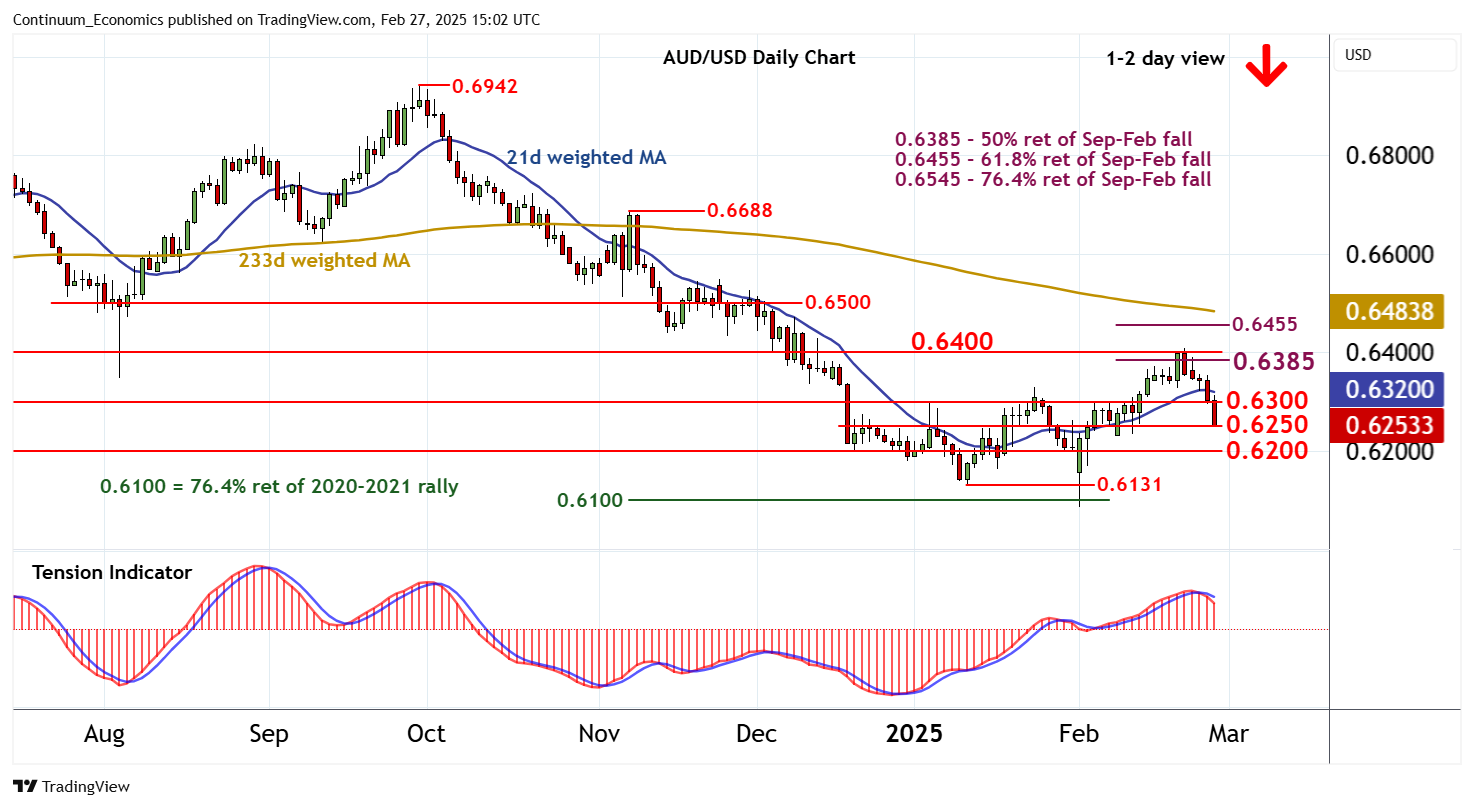
Cautious trade around 0.6300 has given way to further losses
| Levels | Imp | Comment | Levels | Imp | Comment | |||
|---|---|---|---|---|---|---|---|---|
| R4 | 0.6455 | ** | 61.8% ret of Sep-Feb fall | S1 | 0.6250 | * | break level | |
| R3 | 0.6400 | ** | break level | S2 | 0.6200 | ** | congestion | |
| R2 | 0.6385 | ** | 50% ret of Sep-Feb fall | S3 | 0.6131 | * | 13 Jan (m) low | |
| R1 | 0.6300 | ** | congestion | S4 | 0.6100 | ** | 76.4% ret of 2020-2021 rally |
Asterisk denotes strength of level
14:50 GMT - Cautious trade around 0.6300 has given way to further losses, with focus turning to support at 0.6250. Intraday studies are negative and daily readings continue to track lower, highlighting room for a further break beneath here. However, rising weekly charts are expected to limit scope in short-covering/consolidation towards congestion support at 0.6200. Meanwhile, a close back above congestion resistance at 0.6300 would help to stabilise sentiment and prompt consolidation beneath the 0.6385 Fibonacci retracement.