Published: 2026-03-23T14:49:37.000Z
Chart AUD/USD Update: Back in range following volatile pullback
2
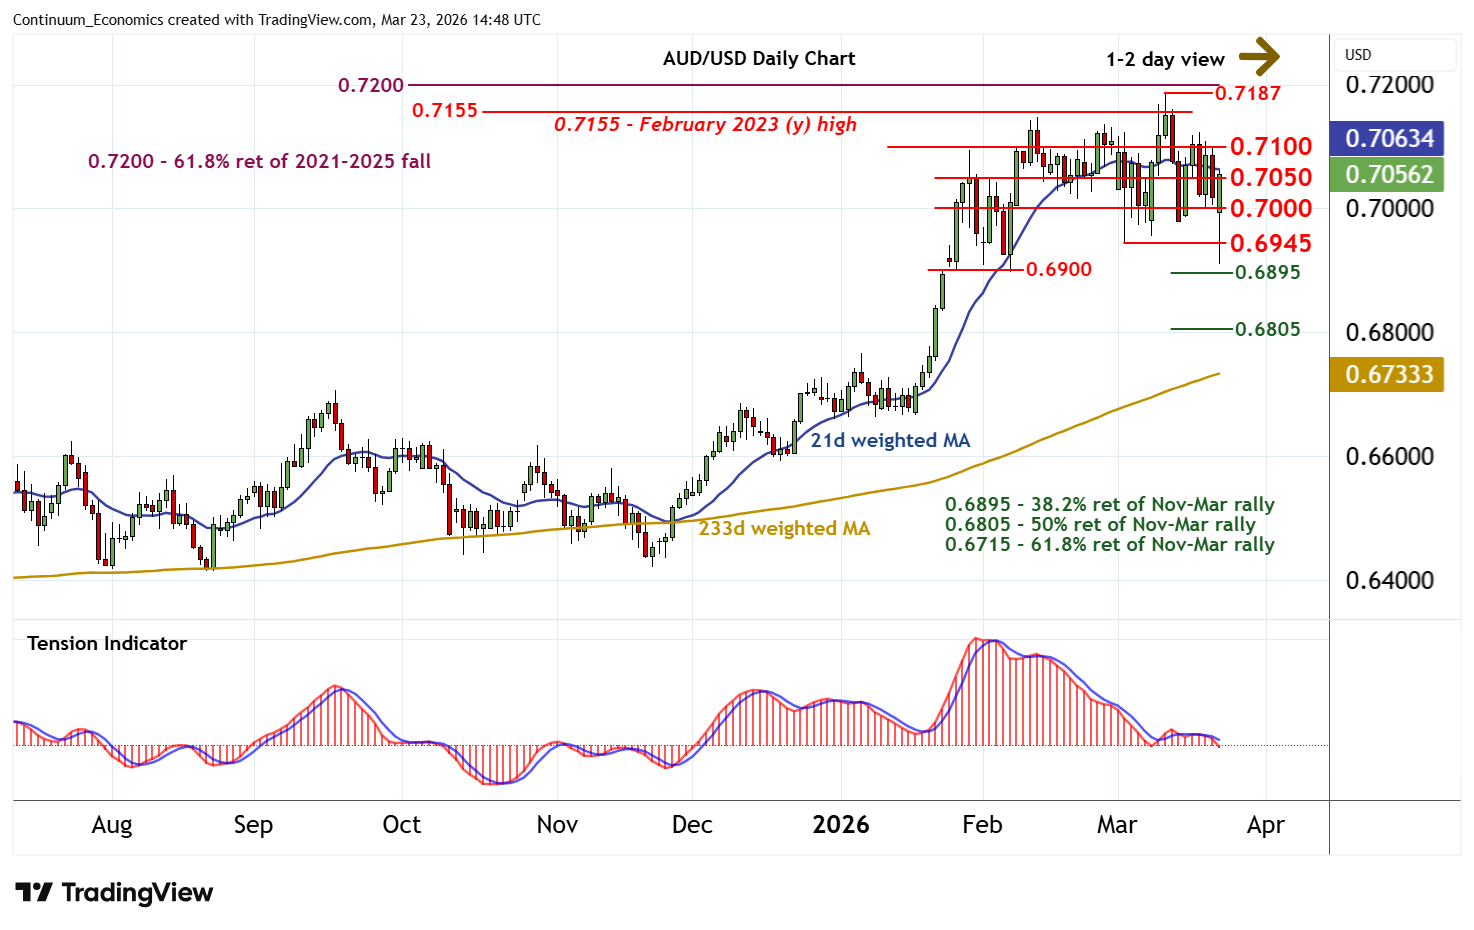
Sharp losses have tested below the 0.6945 weekly low of 3 March
| Levels | Imp | Comment | Levels | Imp | Comment | |||
|---|---|---|---|---|---|---|---|---|
| R4 | 0.7185~ | * | 11 Mar YTD high | S1 | 0.7000 | * | congestion | |
| R3 | 0.7155~ | ** | Feb 2023 (y) high | S2 | 0.6945 | ** | 3 Mar (w) low | |
| R2 | 0.7100 | break level | S3 | 0.6910 | ** | intraday low | ||
| R1 | 0.7050 | * | congestion | S4 | 0.6895/00 | ** | 38.2% ret; break level |
Asterisk denotes strength of level
14:35 GMT - Sharp losses have tested below the 0.6945 weekly low of 3 March, with prices bouncing sharply from just above strong support at the 0.6895 Fibonacci retracement and the 0.6900 break level to pressure congestion resistance at 0.7050. Rising intraday studies highlight room for a test above here. But mixed/negative daily readings and deteriorating weekly charts should limit scope in renewed selling interest towards resistance at 0.7100. Meanwhile, support remains at congestion around 0.7000. But a close below 0.6945 would turn sentiment negative and confirm a deeper correction, as focus then turns back to 0.6895/00.