Published: 2026-02-10T10:06:20.000Z
Chart AUD/USD Update: Fresh 2026 year high - studies improving
2
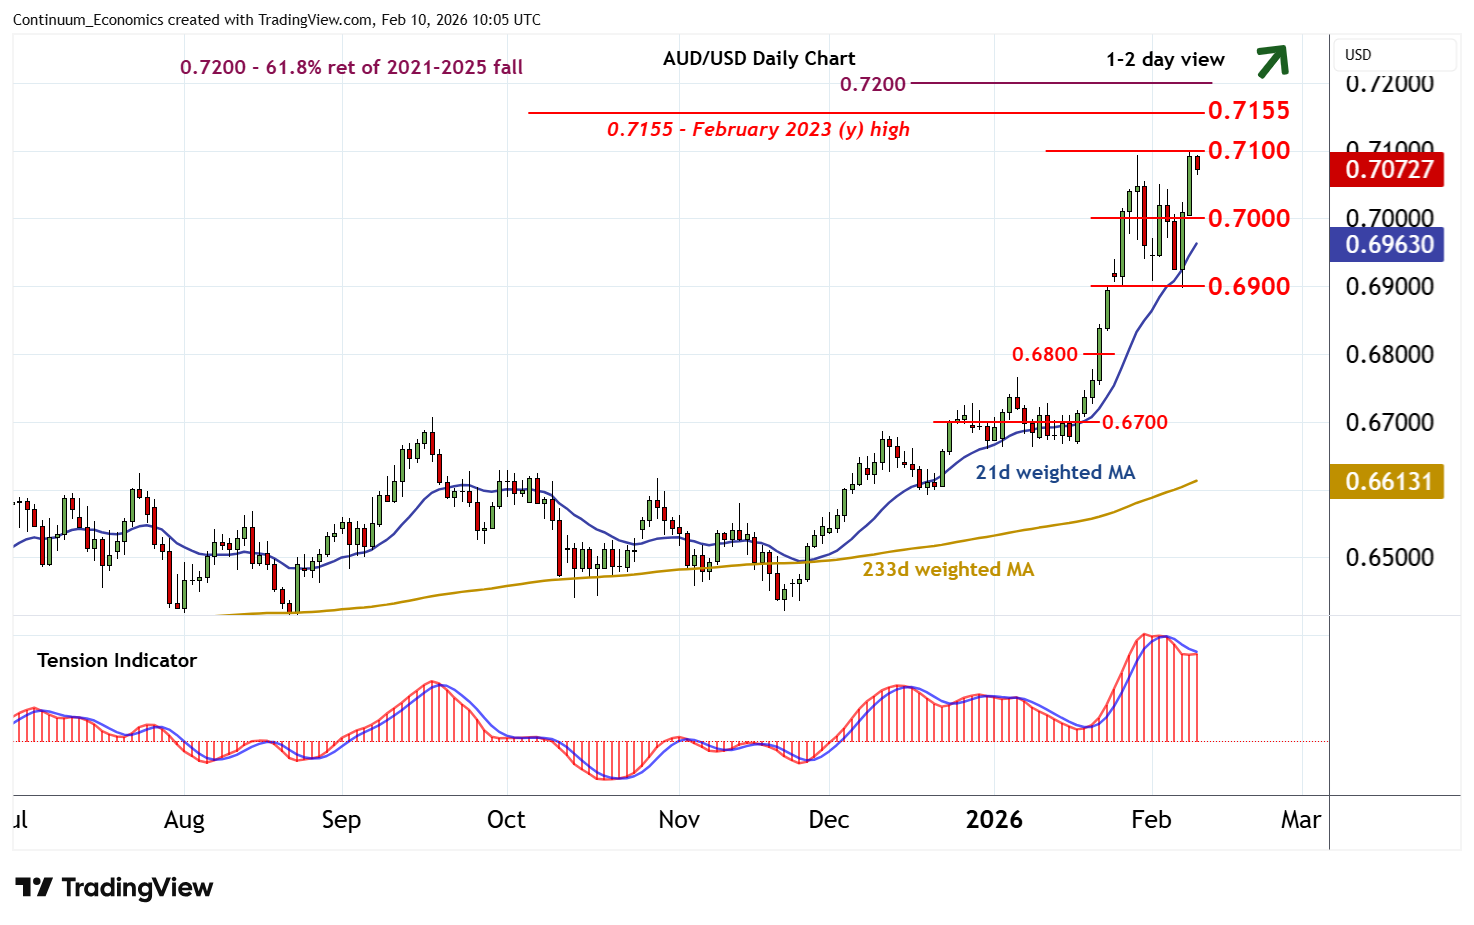
Anticipated gains have posted a fresh year high around 0.7100
| Levels | Imp | Comment | Levels | Imp | Comment | |||
|---|---|---|---|---|---|---|---|---|
| R4 | 0.7280~ | ** | June 2022 high | S1 | 0.7050 | break level | ||
| R3 | 0.7200 | ** | 61.8% ret of 2021-2025 fall | S2 | 0.7000 | * | congestion | |
| R2 | 0.7155~ | ** | February 2023 (y) high | S3 | 0.6900 | ** | break level | |
| R1 | 0.7100 | 9 Feb YTD high | S4 | 0.6800 | ** | break level |
Asterisk denotes strength of level
09:30 GMT - Anticipated gains have posted a fresh year high around 0.7100, where unwinding overbought intraday studies are prompting a short-term pullback. Daily stochastics have ticked higher and the bearish daily Tension Indicator is flattening, suggesting room for further gains in the coming sessions. A break above 0.7100 will improve sentiment and extend April 2025 gains towards strong resistance within the 0.7155~ year high of February 2023 and the 0.7200 Fibonacci retracement. Meanwhile, support is at 0.7050 and extends to congestion around 0.7000. This range should underpin any immediate setbacks.