Published: 2026-01-13T01:47:35.000Z
Chart GBP/USD Update: Higher in consolidation from 1.3390 low
-
Limited on break of the 1.3400 level as prices unwind oversold intraday studies and consolidate losses from the 1.3568 high of last week
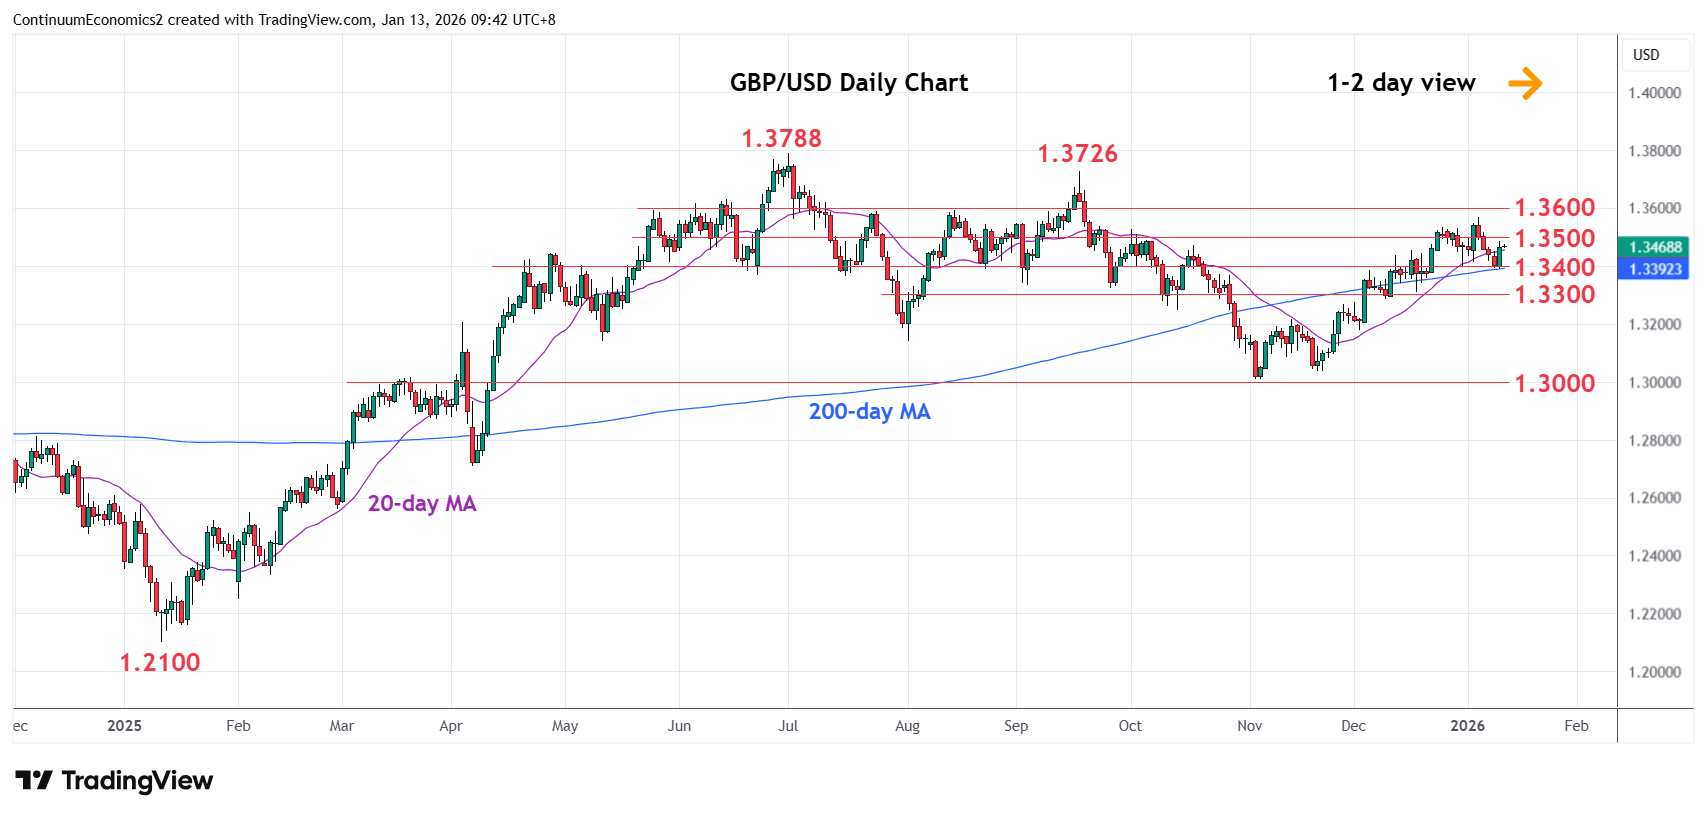
| Level | Comment | Level | Comment | |||||
|---|---|---|---|---|---|---|---|---|
| R4 | 1.3726 | ** | Sep high | S1 | 1.3390 | * | 12 Jan low | |
| R3 | 1.3600 | * | congestion | S2 | 1.3350 | * | congestion | |
| R2 | 1.3568 | * | 6 Jan YTD high | S3 | 1.3300 | * | congestion | |
| R1 | 1.3500 | * | congestion | S4 | 1.3215/00 | ** | 13 Nov high, congestion |
Asterisk denotes strength of level
01:45 GMT - Limited on break of the 1.3400 level as prices unwind oversold intraday studies and consolidate losses from the 1.3568 high of last week. Daily studies are unwinding oversold readings and bounce see room to resistance at the 1.3500 level. Would take break here to clear the way for retest of the 1.3568 high and see room for extension to resistance at the 1.3600 level. Meanwhile, support at the 1.3400/1.3390 area now expected to underpin. Only below this will open up room for deeper pullback to retrace gains from the 1.3010 November low.