Continuum Economics
  • Search
  • About Us
  • Buy
  • Invite A Friend
  • My Basket
  • Articles
  • Calendar
  • Forecasts
  • Events
  • Data
  • Newsletters
  • My Alerts
  • Community
  • Directory
  • About Us
  • Buy
  • Invite A Friend
  • My Basket
  • Articles
    • All
    • Thematic
    • Tactical
    • Asia
    • EMEA
    • Americas
    • Newsletters
    • Freemium
    • Editor's Choice
    • Most Viewed
    • Most Shared
    • Most Liked
  • Calendar
    • Interactive
      • China
      • United States
      • Eurozone
      • United Kingdom
    • Month Ahead
    • Reviews
    • Previews
  • Forecasts
    • Forecasts
    • Key Views
  • Events
    • Media
    • Conference Calls
  • Data
    • Country Insights
    • Shadow Credit Ratings
    • Full CI Data Download
  • Newsletters
  • My Alerts
  • Community
    • FX
    • Fixed Income
    • Macro Strategy
    • Credit Markets
    • Equities
    • Commodities
    • Precious Metals
    • Renewables
  • Directory
  • My Account
  • Notifications Setup
  • Administration Panel
  • Account Details
  • Recent Devices
  • Distribution Lists
  • Shared Free Trials
  • Saved Articles
  • Shared Alerts
  • My Posts
Published: 2025-12-11T13:38:55.000Z

Chartbook: Chart GER 10 Year Yield: Higher in broad range - critical resistance at 3.000% - 3.024%

-

Anticipated minor tests lower have not been seen, as cautious trade above congestion support at 2.500% gives way to a fresh bounce.

Anticipated minor tests lower have not been seen, as cautious trade above congestion support at 2.500% gives way to a fresh bounce.

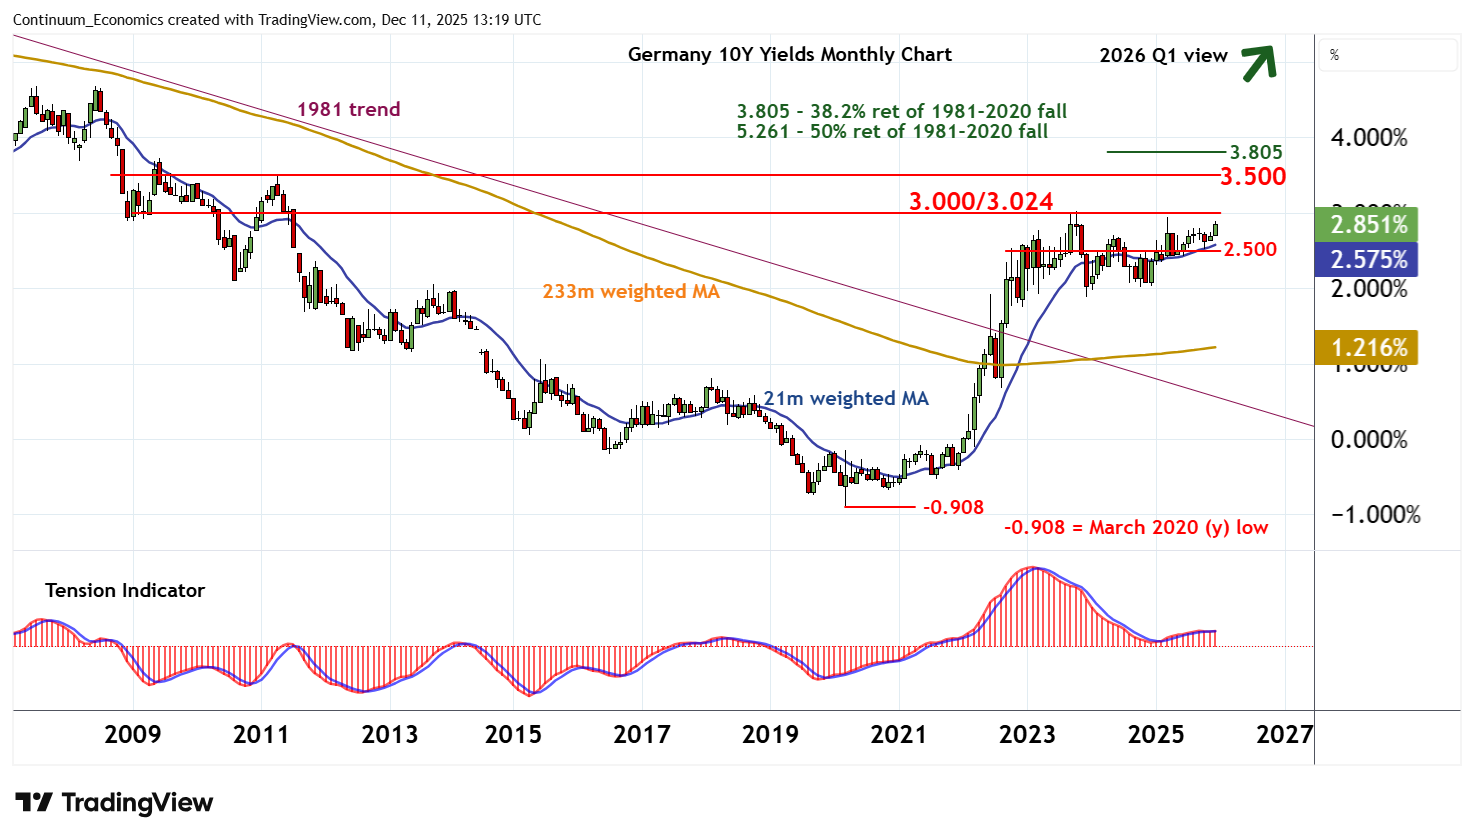
Focus is on critical resistance at congestion around 3.000% and the 3.024% multi-year high of October 2023.

A tick higher in monthly stochastics highlights potential for a test above here.

This will confirm a multi-month period of rising yields, as yields continue to correct the 1981 bear trend and extend gains from the March 2020 year low of -0.908% towards congestion around 3.500%. However, bearish longer-term charts could limit any initial tests of here in fresh consolidation.

Meanwhile, support is at congestion around 2.500% and extends to the 2.436% monthly low of 30 April.

Rising weekly charts should limit any pullbacks in consolidation above here.

A close beneath here, however, would add weight to sentiment and open up support at congestion around 2.300%, where rising monthly charts should prompt fresh consolidation.

An unexpected further break would open up critical support at the 1.887% year low of December 2023 and congestion around 2.000%.

Continue to read the article for free
Login

or

or

Topics
Technical Analysis
ChartBook

GENERAL

  • Home
  • About Us
  • Our Team
  • Careers

LEGAL

  • Terms and Conditions
  • Privacy Policy
  • Compliance
  • GDPR

GET IN TOUCH

  • Contact Us
Continuum Economics
The Technical Analyst Awards Winner 2021
The Technical Analyst Awards Finalist 2020
image