Published: 2026-02-10T08:48:41.000Z
Chart EUR/USD Update: Further gains to remain limited
2
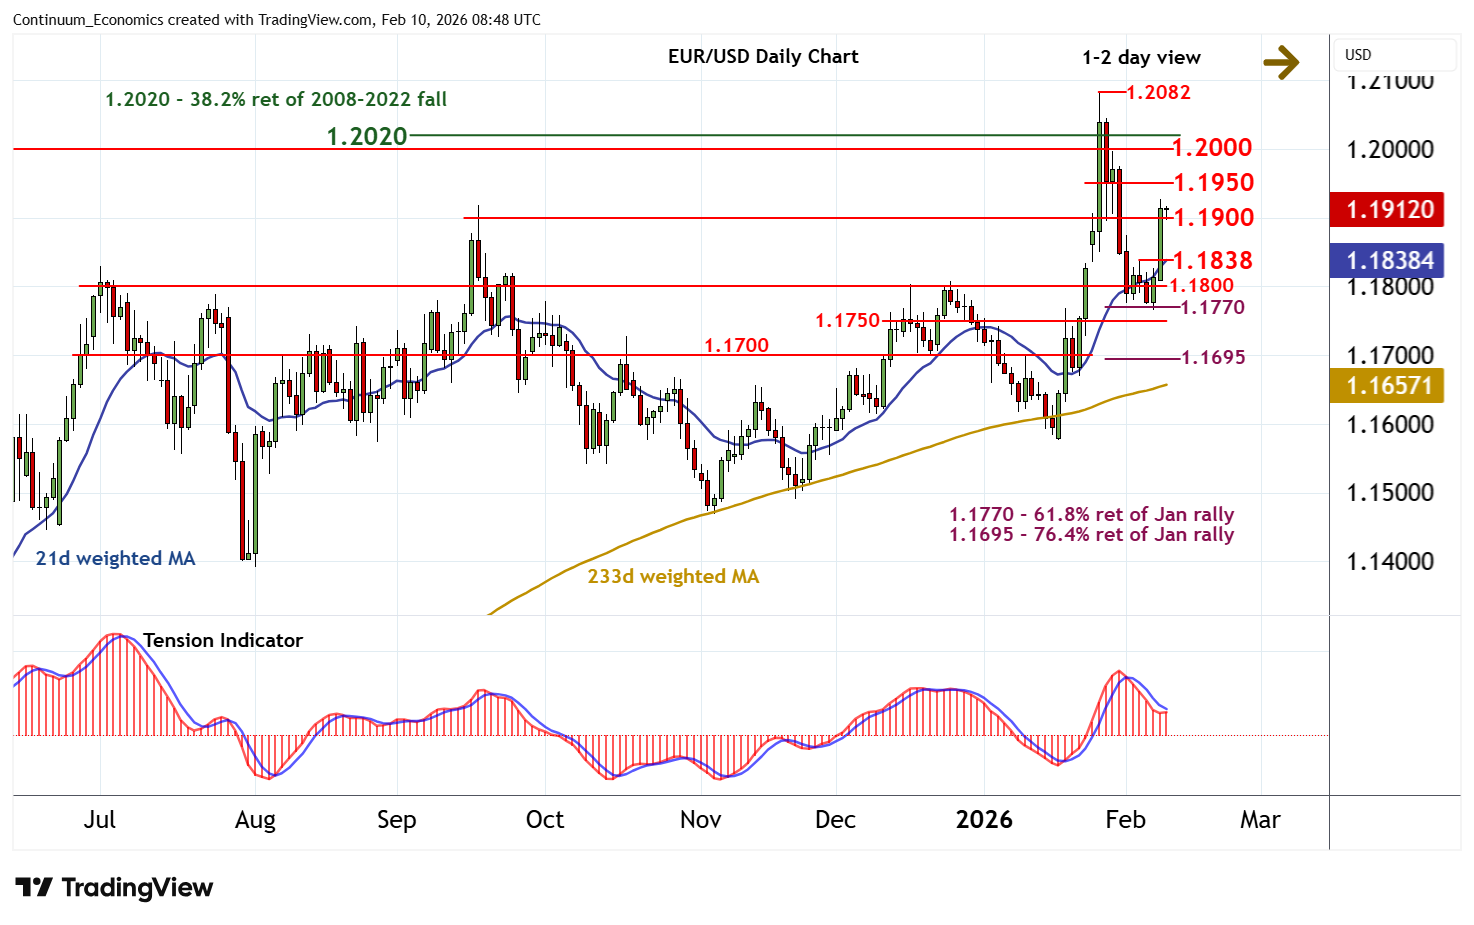
The anticipated test of 1.1900 is giving way to consolidation just above here
| Levels | Imp | Comment | Levels | Imp | Comment | |||
|---|---|---|---|---|---|---|---|---|
| R4 | 1.2082 | ** | 27 Jan YTD high | S1 | 1.1900 | * | congestion | |
| R3 | 1.2020 | ** | 38.2% ret of 2008-2022 fall | S2 | 1.1838 | * | 4 Feb high | |
| R2 | 1.2000 | ** | figure | S3 | 1.1800 | * | congestion | |
| R1 | 1.1950 | break level | S4 | 1.1770 | ** | 61.8% ret of January rally |
*Asterisk denotes strength of level
08:30 GMT - The anticipated test of 1.1900 is giving way to consolidation just above here, as overbought intraday studies turn down, with prices currently balanced around 1.1910. Negative daily stochastics are ticking higher and the bearish daily Tension Indicator is flattening, suggesting room for further gains towards 1.1950. But positive weekly studies are flattening, suggesting any break above here should meet renewed selling interest towards 1.2000 and the 1.2020 Fibonacci retracement. Meanwhile, a close back below 1.1900 will open up the 1.1838 high of 4 February, where fresh consolidation is expected to appear.