Published: 2025-11-19T00:24:16.000Z
Chart AUD/USD Update: Still limited below .6500 level
1
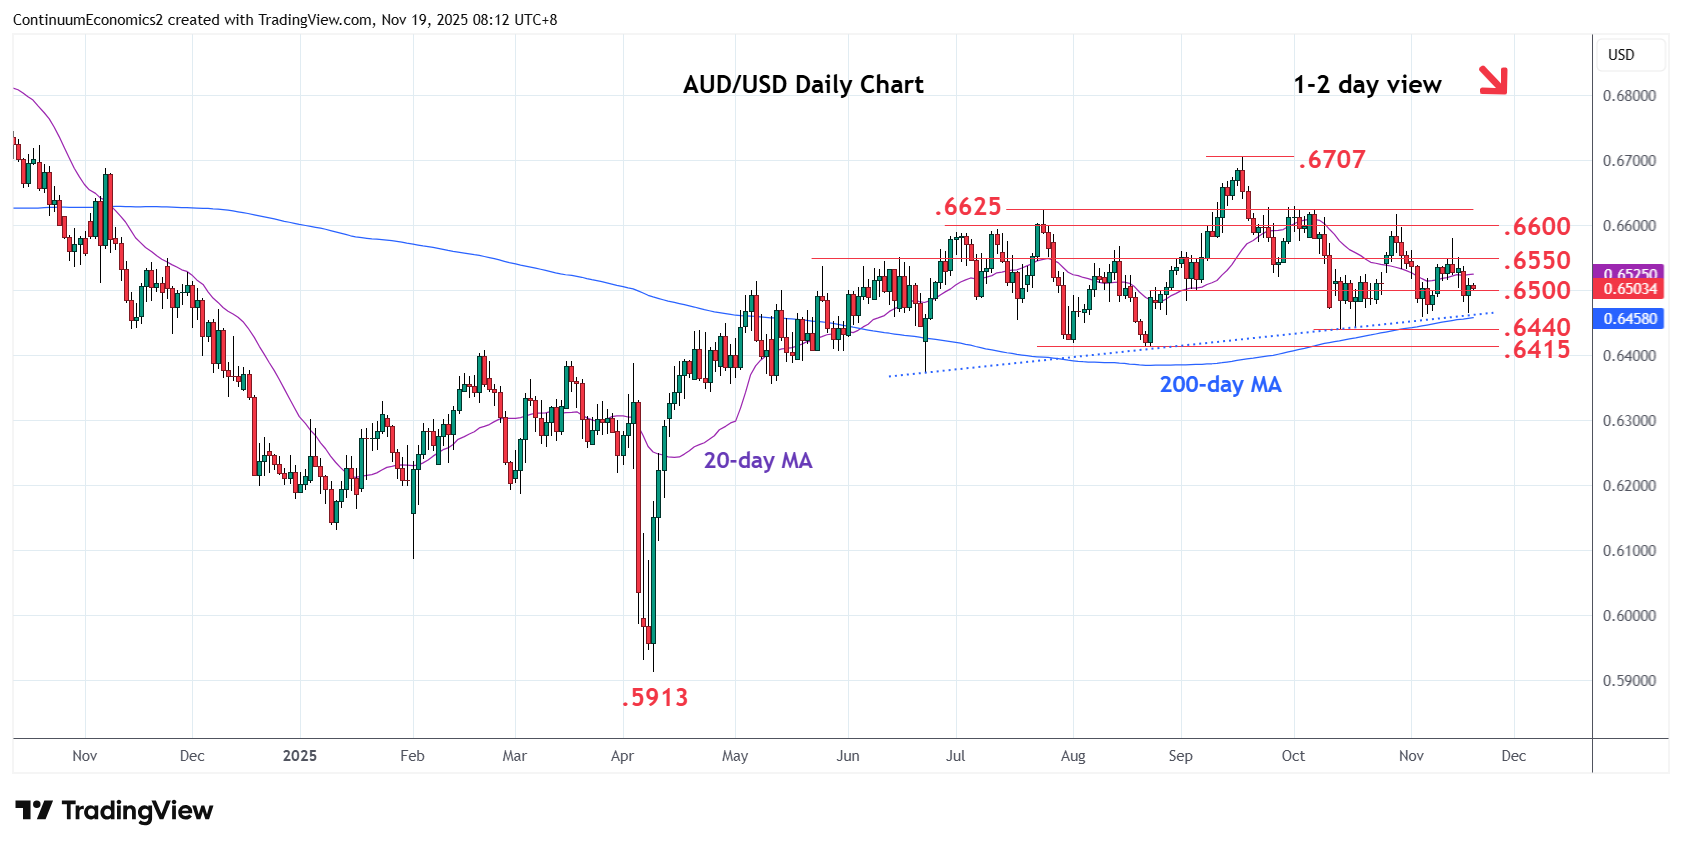
Back to consolidate at the .6500 level following bounce from the .6465 low
| Levels | Imp | Comment | Levels | Imp | Comment | |||
|---|---|---|---|---|---|---|---|---|
| R4 | 0.6625/30 | ** | Jul, Oct highs | S1 | 0.6458 | * | 5 Nov low | |
| R3 | 0.6600 | * | congestion | S2 | 0.6440 | ** | Oct low | |
| R2 | 0.6550 | * | congestion | S3 | 0.6415/00 | ** | Aug low, 38.2% | |
| R1 | 0.6500/20 | * | congestion, 26 Sep low | S4 | 0.6372 | Jun low |
Asterisk denotes strength of level
00:15 GMT - Back to consolidate at the .6500 level following bounce from the .6465 low as prices unwind oversold intraday studies. However, negative daily and weekly studies keep pressure on the downside and threatens test of the recent lows at .6458 and .6440. Would take break here to extend the broader losses from .6707 September current year high to retrace gains from April low and turn focus to the .6415/00 support and 38.2% Fibonacci level. Meanwhile, resistance at the .6500/20 area is expected to cap. Only above here will ease the downside pressure and see room for bounce to .6550.