Published: 2026-03-10T00:28:37.000Z
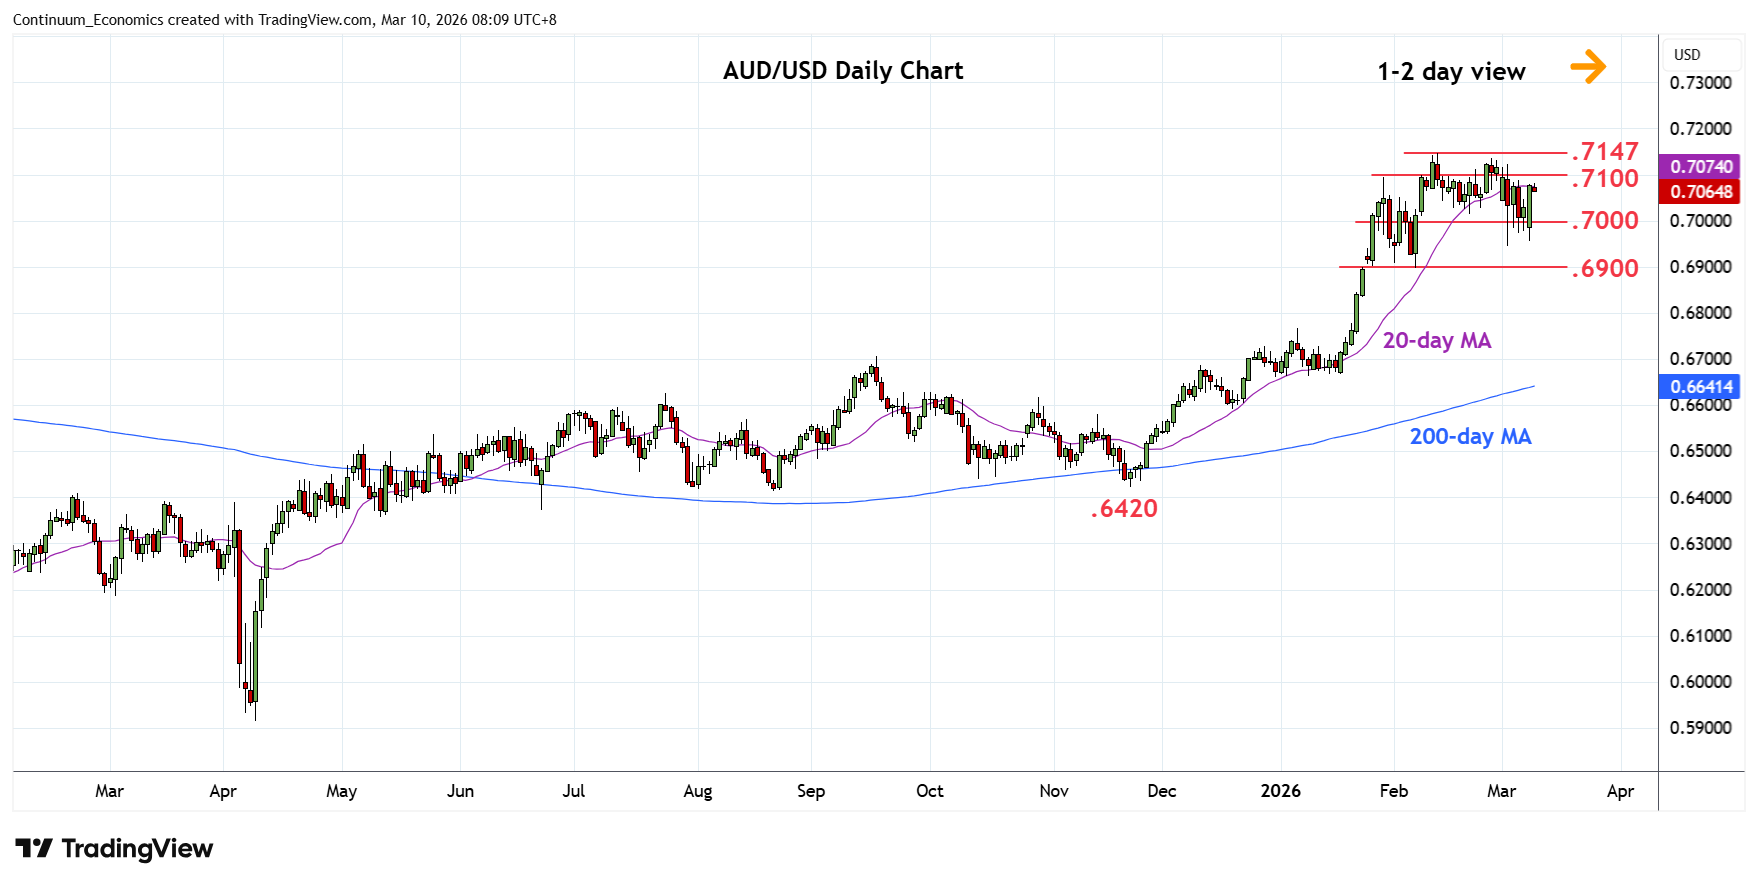
Chart AUD/USD Update: Back within the .7100/.7000 range
1
Turned back from above the .6945 support to return to the .7100/.7000 range area
| Levels | Imp | Comment | Levels | Imp | Comment | |||
|---|---|---|---|---|---|---|---|---|
| R4 | 0.7147 | * | Jun 2022 high | S1 | 0.7000 | * | congestion | |
| R3 | 0.7210 | * | 61.8% 2021/2025 fall | S2 | 0.6945 | ** | 3 Mar low | |
| R2 | 0.7147 | ** | 12 Feb YTD high | S3 | 0.6900 | ** | congestion, 6 Feb low | |
| R1 | 0.7100 | * | congestion | S4 | 0.6870 | * | 38.2% Nov/Feb rally |
Asterisk denotes strength of level
00:25 GMT - Turned back from above the .6945 support to return to the .7100/.7000 range area. Daily studies have turned mixed and suggest further ranging within this range area. Regaining the .7100 level will return focus to the .7137/.7147 highs and where break will see resumption of the broader gains from the April 2025 low. Clearance will see room to .7210, 61.8% Fibonacci level. Meanwhile, support at the .7015/.7000 area and extending to the .6945 low should underpin. Only below these will open up room for deeper pullback to retrace the November/February rally.