Published: 2026-01-07T16:47:09.000Z
Chart USD/CAD Update: Pushing higher
1
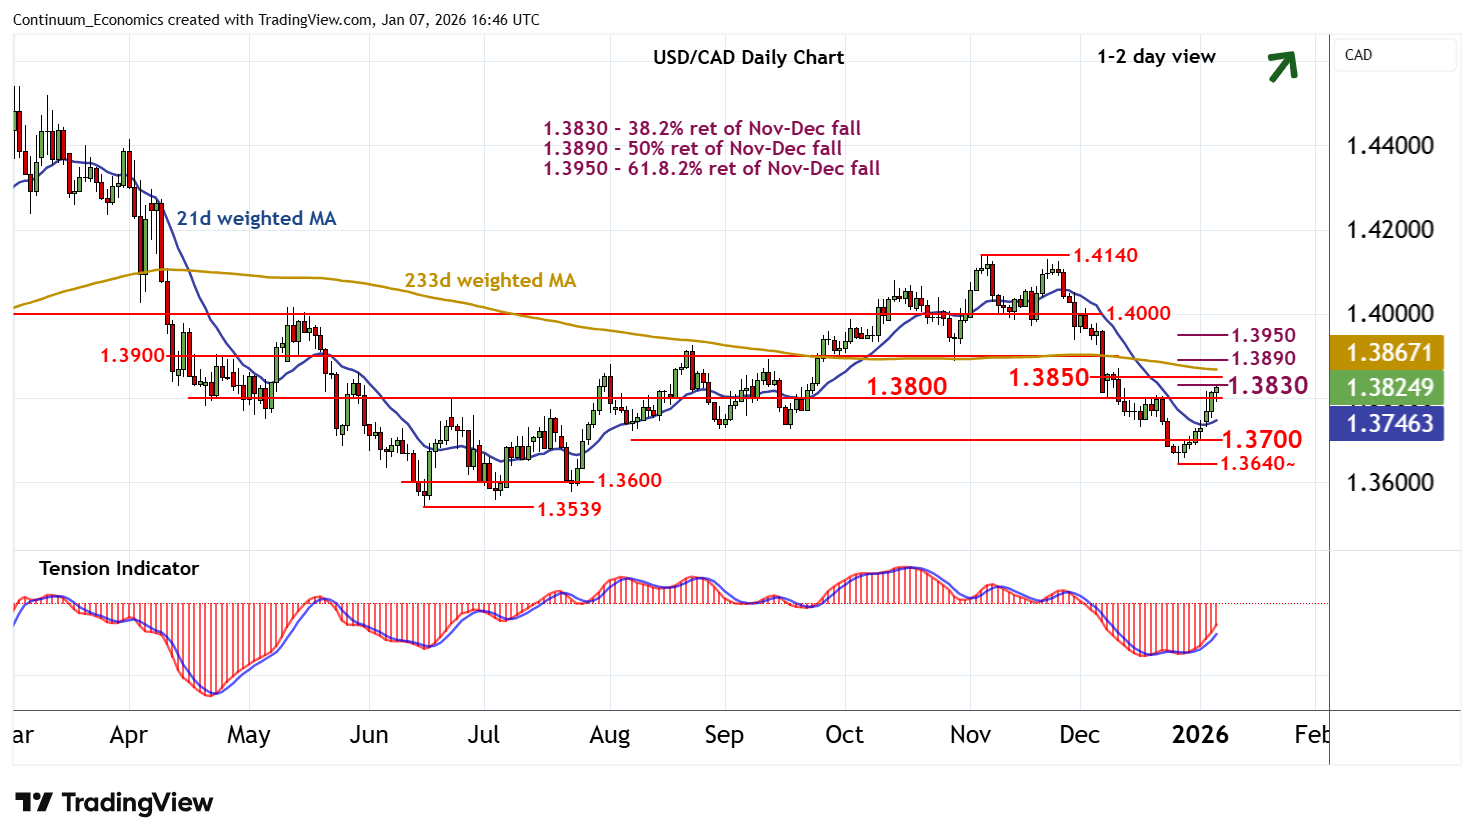
Anticipated gains have reached resistance at the 1.3830 Fibonacci retracement
| Levels | Imp | Comment | Levels | Imp | Comment | |||
|---|---|---|---|---|---|---|---|---|
| R4 | 1.3950 | ** | 61.8% ret of Nov-Dec fall | S1 | 1.3800 | ** | congestion | |
| R3 | 1.3890/00 | ** | 50% ret; break level | S2 | 1.3700 | * | congestion | |
| R2 | 1.3850 | congestion | S3 | 1.3640 | * | 26 Dec (w) low | ||
| R1 | 1.3830 | * | 38.2% ret of Nov-Dec fall | S4 | 1.3600 | * | congestion |
Asterisk denotes strength of level
16:30 GMT - Anticipated gains have reached resistance at the 1.3830 Fibonacci retracement, where deteriorating intraday studies are prompting short-term reactions. The rising daily Tension Indicator suggests room for continuation towards congestion resistance at 1.3850. But already overbought daily stochastics and mixed weekly charts are expected to limit any break in renewed selling interest beneath 1.3890/00. Meanwhile, support is raised to congestion around 1.3800. A close beneath here would help to stabilise price action and prompt consolidation above further congestion around 1.3700.