Published: 2025-12-03T07:35:08.000Z
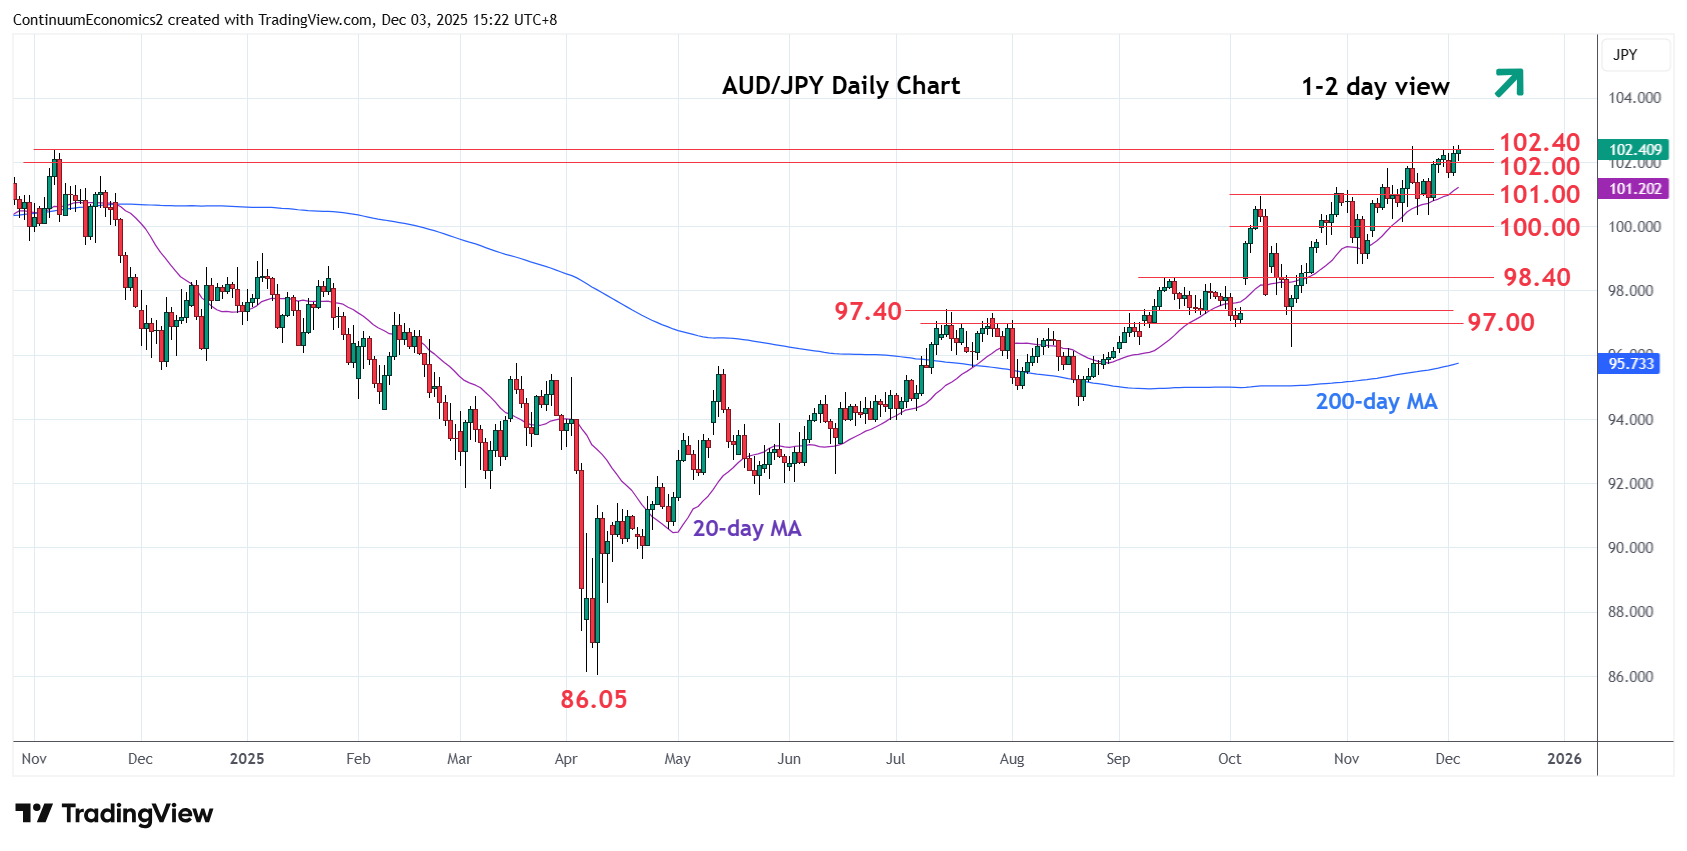
Chart AUD/JPY Update: Pressuring 102.40, November 2024 high
-
Break above the 102.00 level has seen prices back to retest the 102.40, November 2024 high
| Levels | Imp | Comment | Levels | Imp | Comment | |||
|---|---|---|---|---|---|---|---|---|
| R4 | 104.00 | * | congestion | S1 | 101.50 | * | 1 Dec low | |
| R3 | 103.85 | * | 76.4% 2024/Apr low | S2 | 101.00 | * | congestion | |
| R2 | 103.00 | * | congestion | S3 | 100.00 | * | congestion | |
| R1 | 102.40 | ** | Nov 2024 high | S4 | 98.80 | ** | 5 Nov low |
Asterisk denotes strength of level
07:30 GMT - Break above the 102.00 level has seen prices back to retest the 102.40, November 2024 high. Daily and weekly studies remains stretched but bullish structure from the 86.05 April current year low suggest scope for break to further retrace losses from the July 2024 year high. Clearance will see room to the 103.00 congestion then 103.85, 76.4% Fibonacci level. Meanwhile, support is raised to the 101.50/101.00 congestion area which should underpin. Only below here fade the upside pressure and see room for deeper pullback to strong support at the 100.00/98.80 area.