Published: 2026-02-27T01:26:58.000Z
Chart EUR/JPY Update: Turned lower in range
1
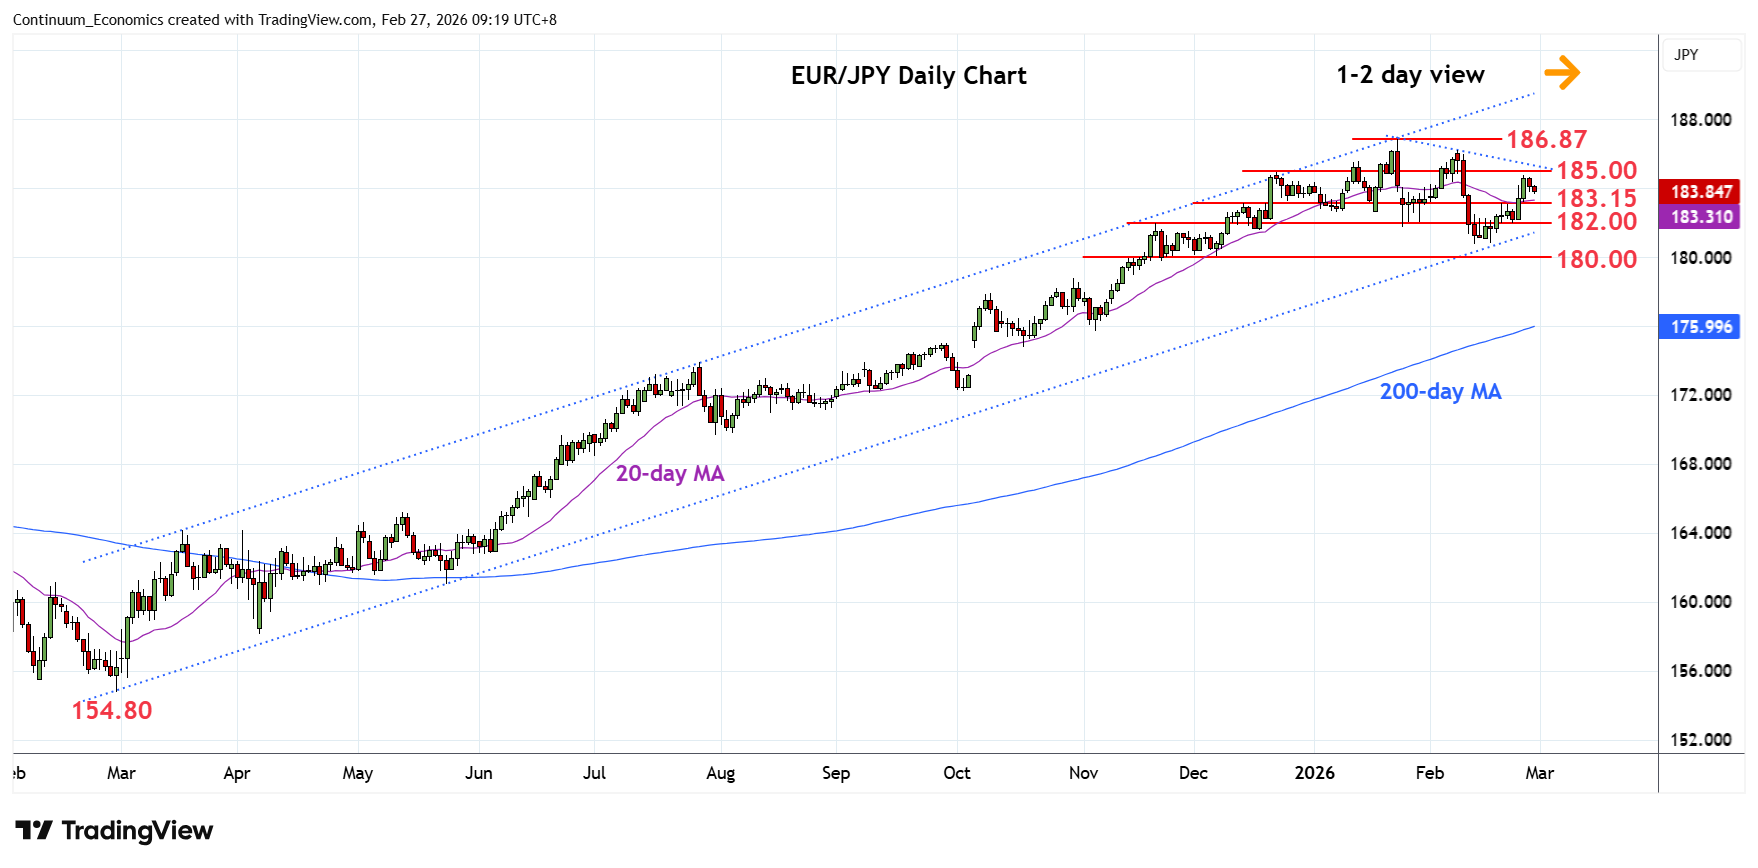
Lower in range from the 184.77 mid-week high as prices unwind overbought intraday studies
| Levels | Imp | Comment | Levels | Imp | Comment | |||
|---|---|---|---|---|---|---|---|---|
| R4 | 188.20 | ** | May 1990 year high | S1 | 183.15/00 | * | 19 Feb high, congestion | |
| R3 | 186.87 | ** | 23 Jan YTD high | S2 | 182.00 | * | congestion | |
| R2 | 186.22 | * | 9 Feb high | S3 | 180.80 | ** | 12 Feb YTD low | |
| R1 | 184.92/00 | ** | Dec high, congestion | S4 | 180.00 | ** | congestion |
Asterisk denotes strength of level
01:20 GMT - Lower in range from the 184.77 mid-week high as prices unwind overbought intraday studies. Daily studies are stretched as well and suggest strong resistance at the 184.92/185.00 area expected to cap and keep gains in check. Return below the 184.00 level will open up room for retest of support at the 183.15/00 area and where break will return open up room for deeper pullback to the 182.00 level. Would take break of the here to return focus to the 180.80 low and see room for deeper pullback to retrace rally from the February 2025 year low.