Published: 2025-05-16T02:09:57.000Z
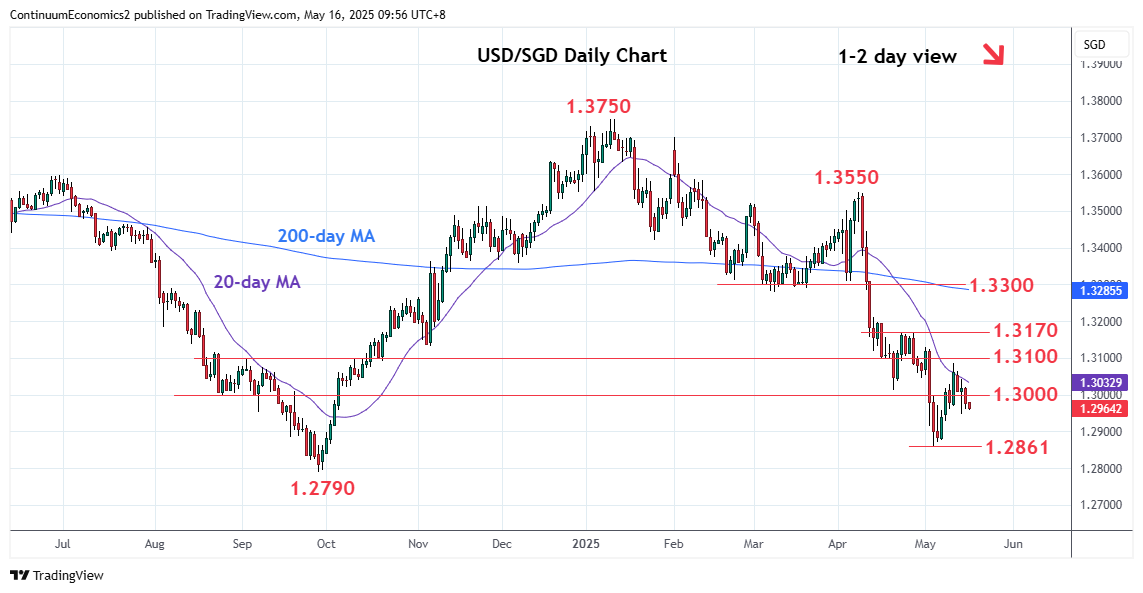
Chart USD/SGD Update: Under pressure

Technical Analyst
-
Under pressure as price extend Monday's rejection from test of the 1.3080, Fibonacci level
| Level | Comment | Level | Comment | ||||
|---|---|---|---|---|---|---|---|
| R4 | 1.3170 | ** | 23 Apr high, 50% | S1 | 1.2947 | * | 14 May low |
| R3 | 1.3100/30 | * | congestion, 1 May high | S2 | 1.2900 | * | congestion |
| R2 | 1.3080 | * | 38.2% Apr/May fall | S3 | 1.2861 | ** | 5 May YTD low |
| R1 | 1.3000 | * | congestion | S4 | 1.2790 | ** | Sep 2024 multi-year low |
Asterisk denotes strength of level
02:05 GMT - Under pressure as price extend Monday's rejection from test of the 1.3080, Fibonacci level. Intraday and daily studies are tracking lower from overbought areas and see the mid-week low at 1.2947 now at risk. Break here will open up room for extension to 1.2900 congestion then 1.2861, 5th May current year low. Below this will see room for extension to retest 1.2790, September 2024 year low. Meanwhile, resistance is lowered to the 1.3000 congestion which is expected to cap and sustain rejection from the 1.3080, Fibonacci level.