Published: 2025-09-10T08:14:17.000Z
Chart USD Index DXY Update: Back in range
0
2
The bounce from the 96.25 low of 9 September has extended
| Levels | Imp | Comment | Levels | Imp | Comment | |||
|---|---|---|---|---|---|---|---|---|
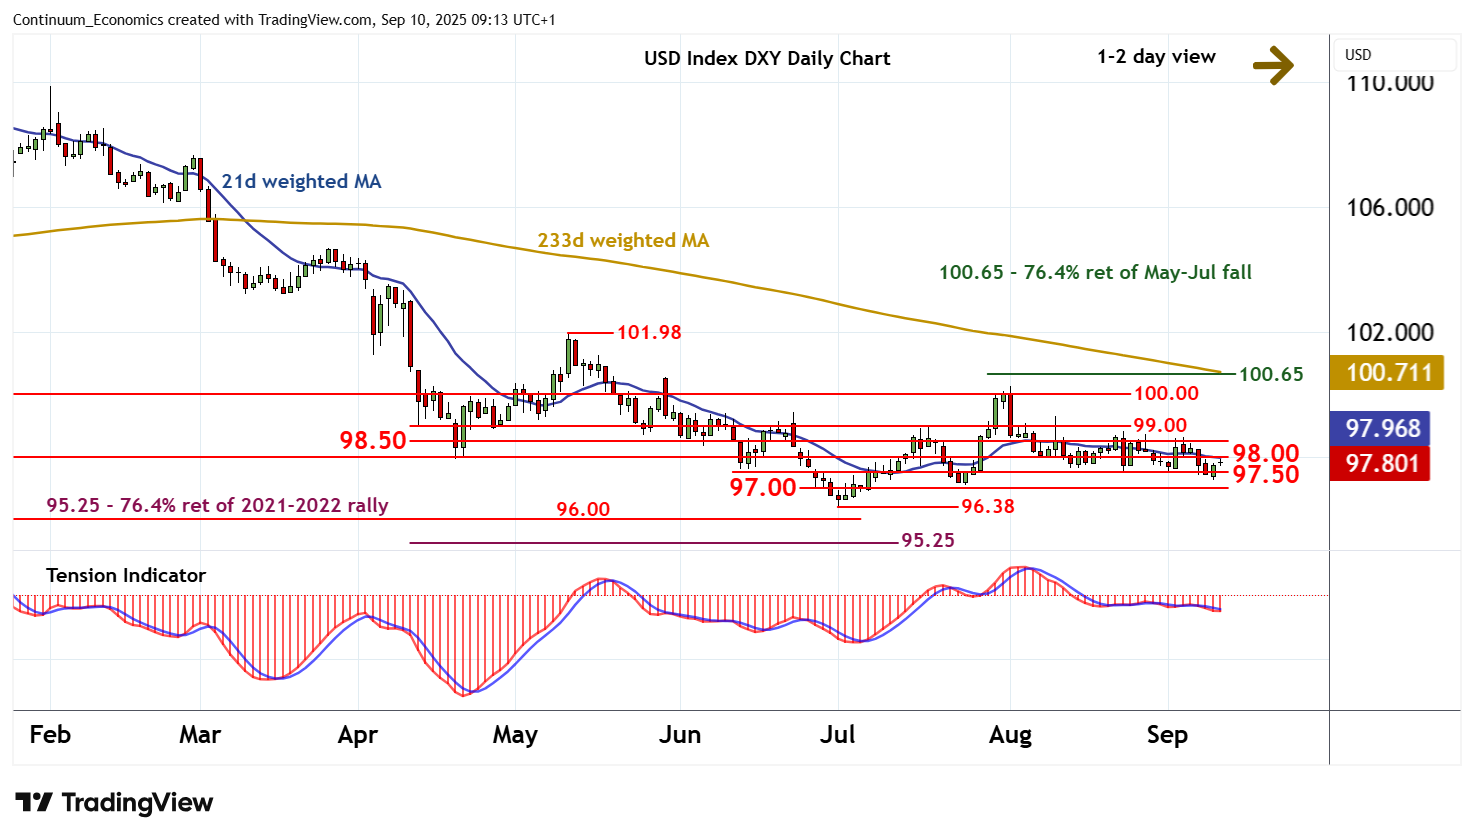
| R4 | 100.00 | ** | break level | S1 | 97.50 | * | congestion | |
| R3 | 99.00 | * | break level | S2 | 97.00 | * | congestion | |
| R2 | 98.50 | congestion | S3 | 96.38 | ** | 1 Jul YTD low | ||
| R1 | 98.00 | * | congestion | S4 | 96.00 | * | historic congestion |
Asterisk denotes strength of level
09:00 BST - The bounce from the 96.25 low of 9 September has extended, with prices once again trading above 97.50 as cautious sentiment keeps near-term price action choppy. Oversold daily stochastics are edging higher, suggesting room for a test of congestion resistance at 98.00. But the flat daily Tension Indicator and mixed weekly charts are expected to limit any break in renewed selling interest towards further congestion around 98.50. Meanwhile, support remains at 97.50 and extends to further congestion around 97.00. A break beneath here would turn sentiment negative and open up critical support at the 96.38 current year low of 1 July.