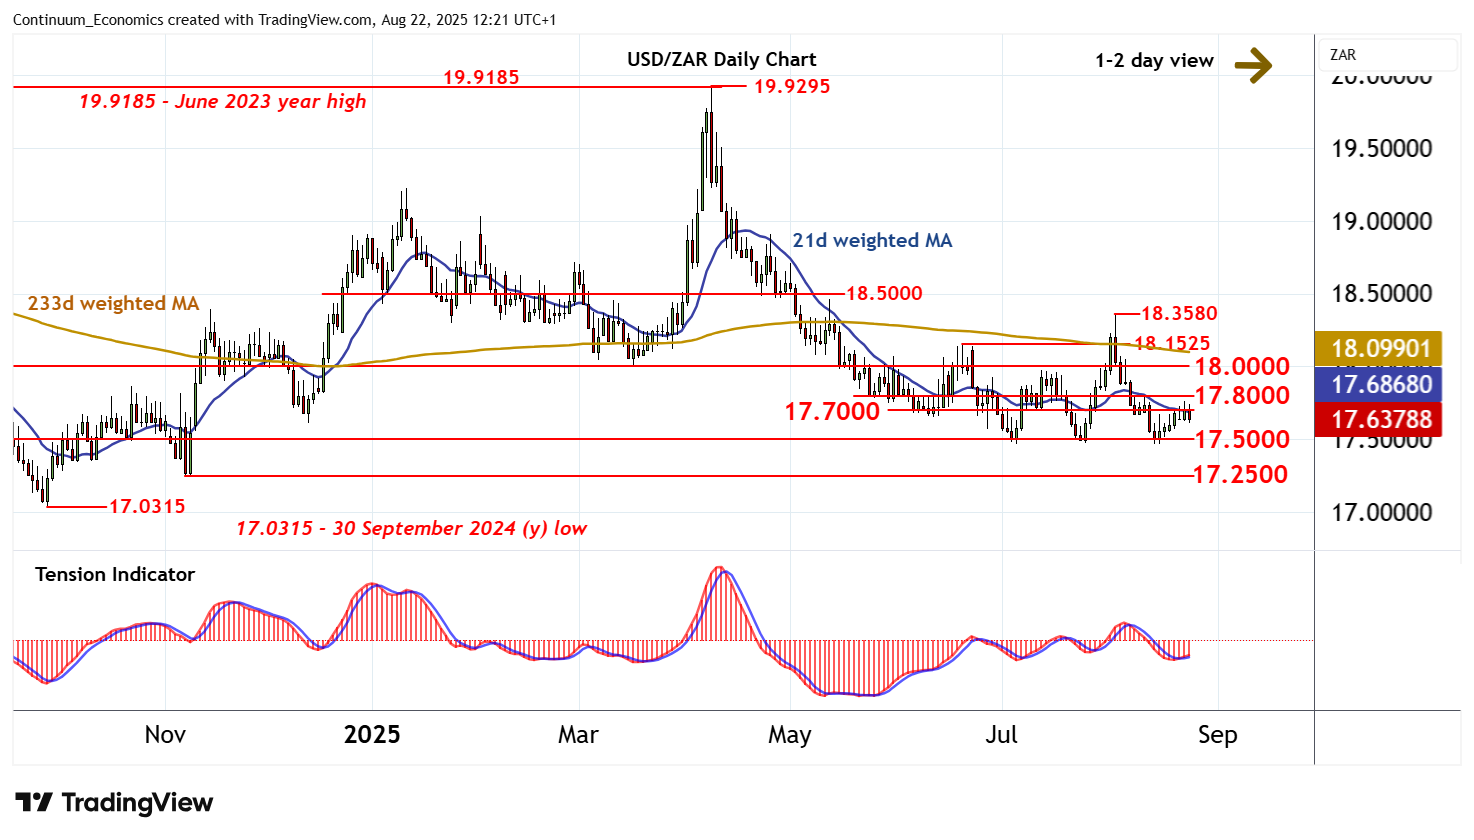
Chart USD/ZAR Update: Lower in range
Consolidation around congestion resistance at 17.7000 is giving way to a drift lower
| Level | Comment | Level | Comment | |||||
|---|---|---|---|---|---|---|---|---|
| R4 | 18.1525 | ** | 19 Jun (m) high | S1 | 17.5000 | ** | congestion | |
| R3 | 18.0000 | ** | congestion | S2 | 17.4690 | ** | 4 Jul YTD low | |
| R2 | 17.8000 | * | congestion | S3 | 17.2500 | ** | 7 Nov (m) low | |
| R1 | 17.7000 | * | congestion | S4 | 17.0315 | ** | 30 Sep 2024 (y) low |
Asterisk denotes strength of level
12:10 BST - Consolidation around congestion resistance at 17.7000 is giving way to a drift lower, as intraday studies turn down, with prices currently trading around 17.6325. Immediate focus is on support at congestion around 17.5000 and the 17.4690 current year low of 4 July, where rising daily readings are expected to limit any initial tests in fresh consolidation. Broader weekly charts are negative, but a close beneath here is needed to turn sentiment negative and confirm continuation of April losses. Meanwhile, resistance remains at 17.7000 and extends to further congestion around 17.8000. This range should cap any immediate tests higher.