Published: 2026-02-09T09:22:02.000Z
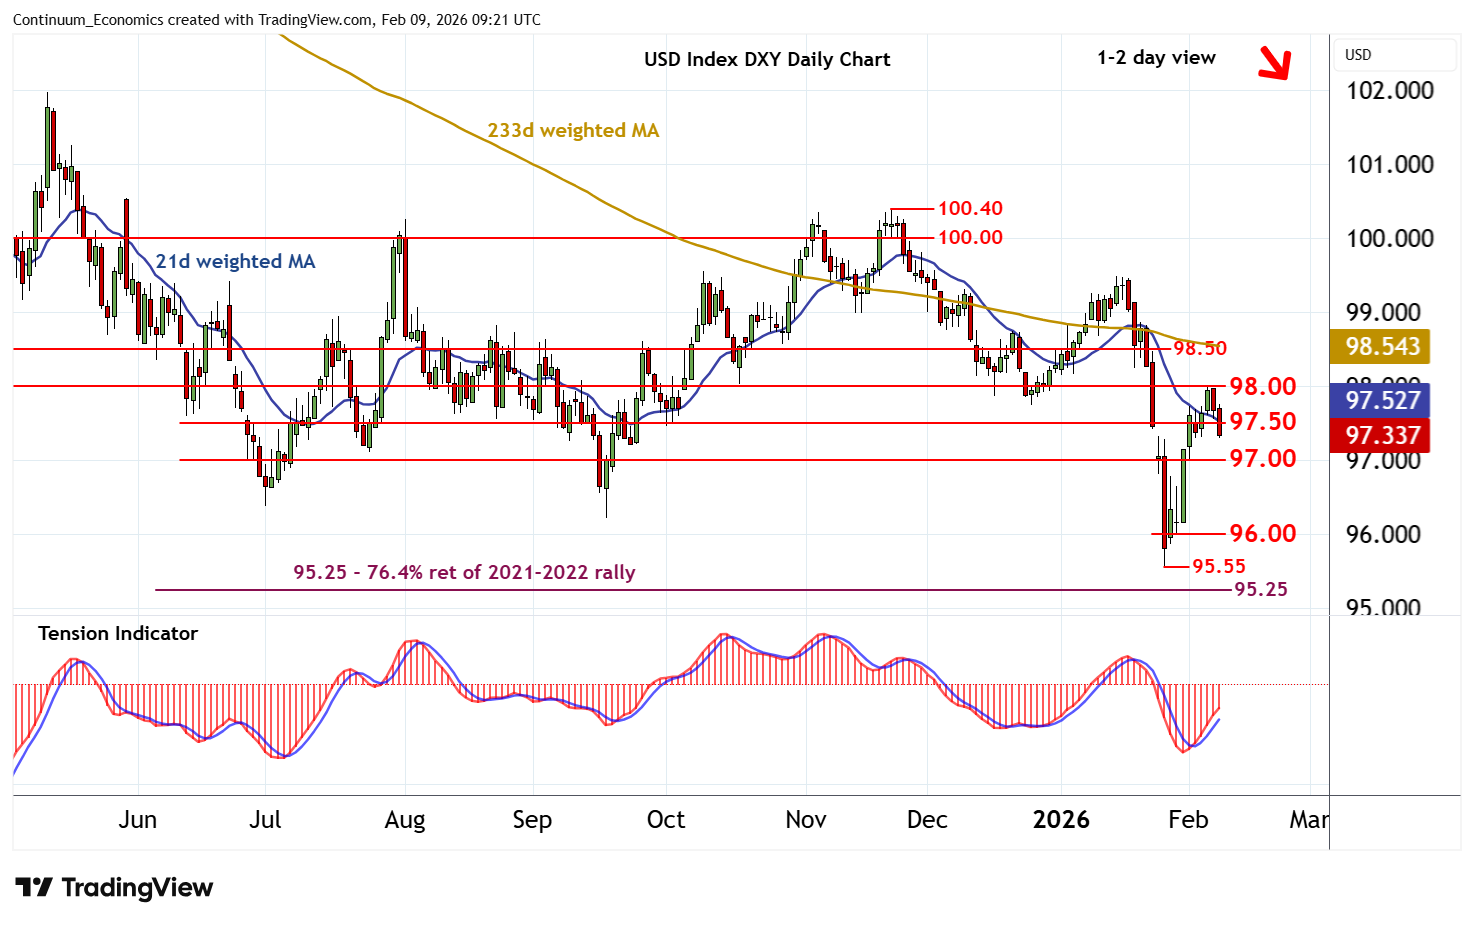
Chart USD Index DXY Update: Lower from 98.00 - focus on 97.00
2
Consolidation following the test of congestion resistance at 98.00 has given way to steady selling interest
| Levels | Imp | Comment | Levels | Imp | Comment | |||
|---|---|---|---|---|---|---|---|---|
| R4 | 99.00 | * | congestion | S1 | 97.00 | * | congestion | |
| R3 | 98.50 | * | congestion | S2 | 96.00 | * | congestion | |
| R2 | 98.00 | * | congestion | S3 | 95.55 | ** | 27 Jan YTD low | |
| R1 | 97.50 | ** | congestion | S4 | 95.25 | ** | 76.4% ret of 2021-2022 rally |
Asterisk denotes strength of level
09:05 GMT - Consolidation following the test of congestion resistance at 98.00 has given way to steady selling interest, with prices currently trading around 97.35. Intraday studies are bearish, highlighting room for continuation down to congestion support at 97.00. But rising daily readings are expected to limit any initial tests in renewed consolidation, before mixed/negative weekly charts extend losses still further. Meanwhile, resistance is at congestion around 97.50. A close back above here, if seen, will help to stabilise price action and prompt consolidation beneath 98.00.