Published: 2026-03-26T00:28:30.000Z
Chart AUD/USD Update: Under pressure
1
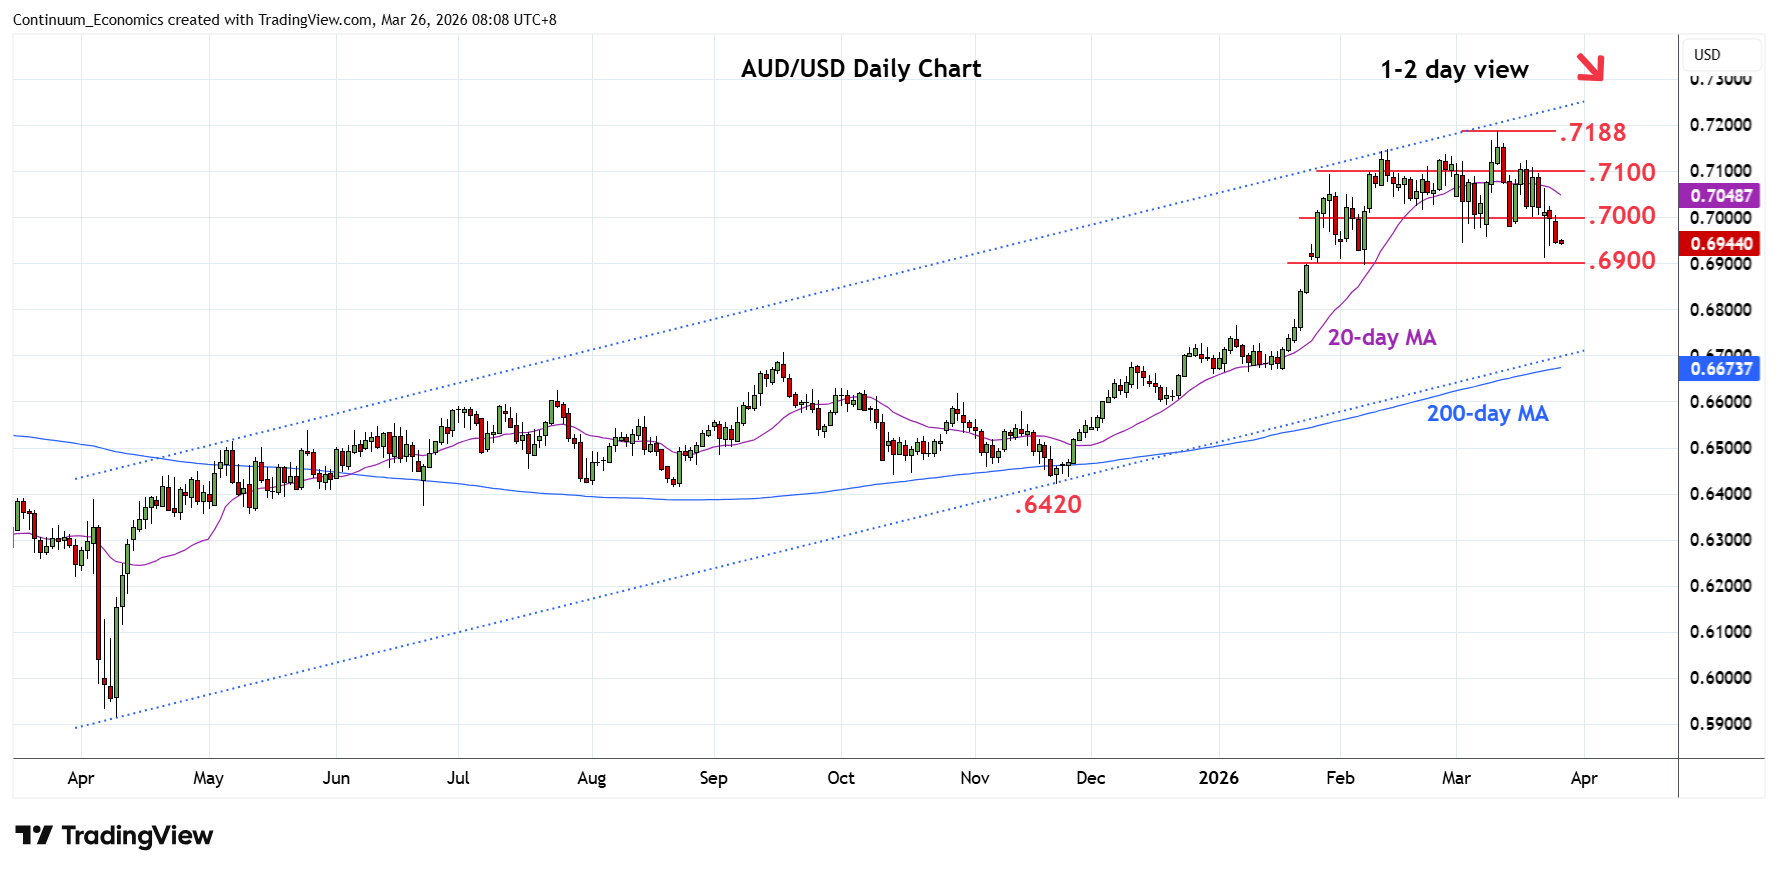
Under pressure, as break below the .7000 level opens up the pin bar lows at .6945 and .6910 to retest
| Levels | Imp | Comment | Levels | Imp | Comment | |||
|---|---|---|---|---|---|---|---|---|
| R4 | 0.7188 | ** | 11 Mar YTD high | S1 | 0.6910/00 | ** | 23 Mar, Feb lows | |
| R3 | 0.7100 | * | congestion | S2 | 0.6895 | * | 38.2% Nov/Mar rally | |
| R2 | 0.7050 | * | congestion | S3 | 0.6805/00 | * | 50%, congestion | |
| R1 | 0.7000 | * | congestion | S4 | 0.6715 | * | 61.8% Nov/Mar rally |
Asterisk denotes strength of level
00:15 GMT - Under pressure, as break below the .7000 level opens up the pin bar lows at .6945 and .6910 to retest. Negative daily and weekly studies suggest choppy trade giving way to selling pressure where break will see room for extension to .6895, 3.2% Fibonacci level. Below this will open up room for deeper pullback to .6805, 50% Fibonacci level. Meanwhile, resistance is lowered to the .7000 congestion which is expected to cap and immediate bounce. Above here will ease the downside pressure and see consolidation to resistance at the .7050/.7100 congestion area.