Chart EUR/JPY Update: Range extension - background studies under pressure
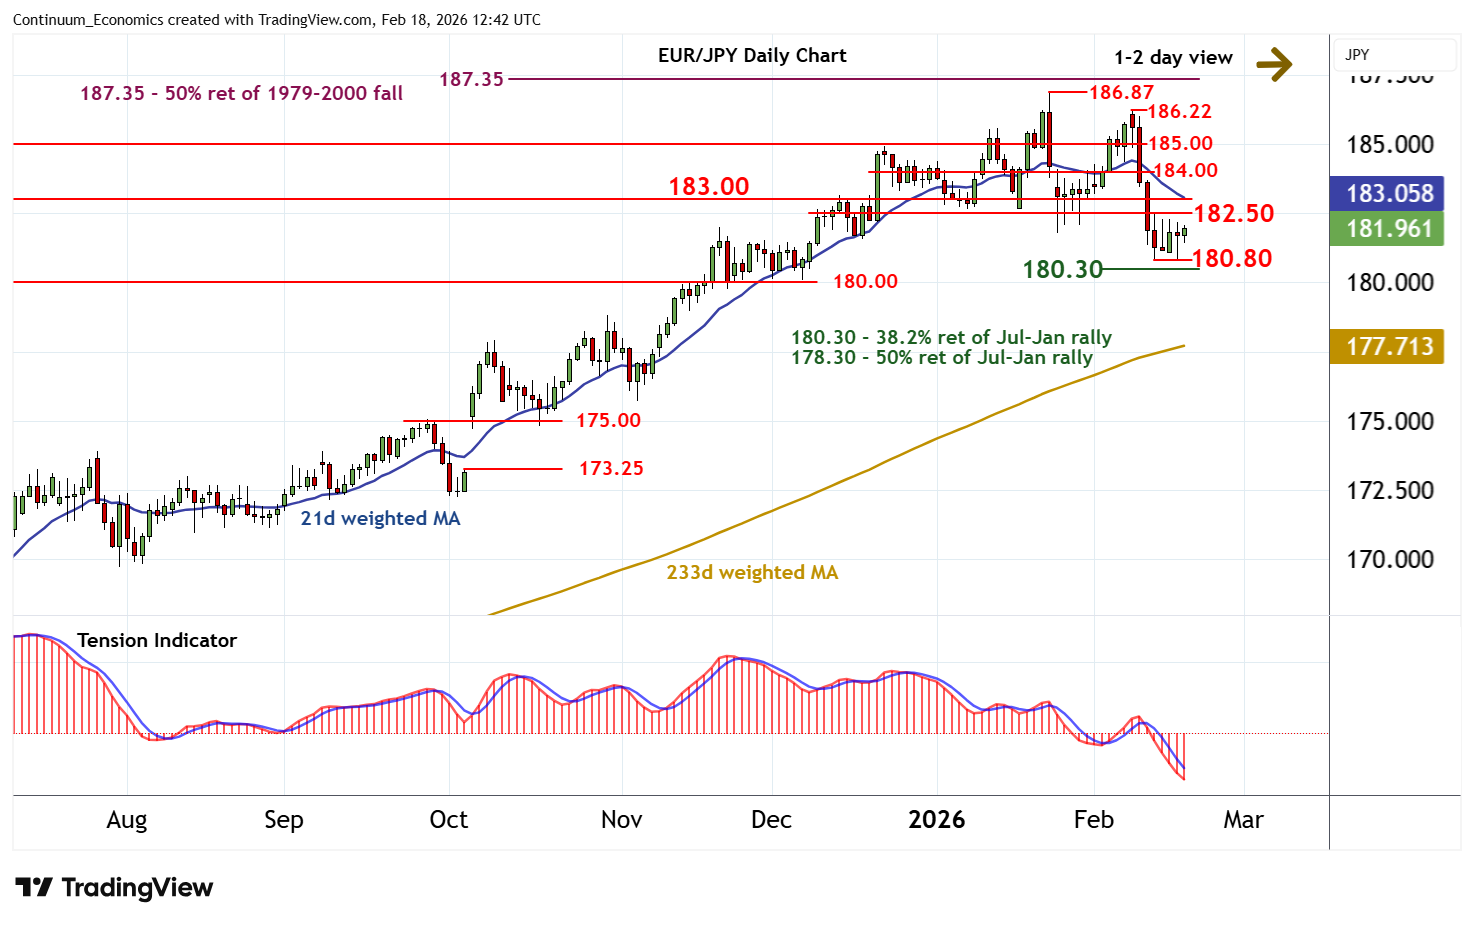
Consolidation above strong support at the 180.80 current year low of 12 February has given way to a drift higher
| Levels | Imp | Comment | Levels | Imp | Comment | |||
|---|---|---|---|---|---|---|---|---|
| R4 | 185.00 | ** | break level | S1 | 181.00 | ** | congestion | |
| R3 | 184.00 | * | congestion | S2 | 180.80 | * | 12 Feb YTD low | |
| R2 | 183.00 | * | break level | S3 | 180.30 | * | 38.2% ret of Jul-Jan rally | |
| R1 | 182.50 | * | break level | S4 | 180.00 | ** | congestion |
Asterisk denotes strength of level
12:15 GMT - Consolidation above strong support at the 180.80 current year low of 12 February has given way to a drift higher, as intraday studies improve, with prices currently pressuring 182.00. Oversold daily stochastics are unwinding, highlighting room for continuation towards resistance at 182.50. But the bearish daily Tension Indicator and negative weekly charts should prompt renewed selling interest towards here. Following cautious/corrective trade, fresh losses are looked for. Support is at congestion around 181.00 and extends to 180.00. A close beneath here will add weight to sentiment and confirm a near-term top in place at the 186.87 current year high of 23 January. Focus will then turn to the 180.30 Fibonacci retracement, with negative weekly charts pointing at room for still deeper losses.