Published: 2026-03-09T01:52:31.000Z
Chart GBP/USD Update: Under pressure
2
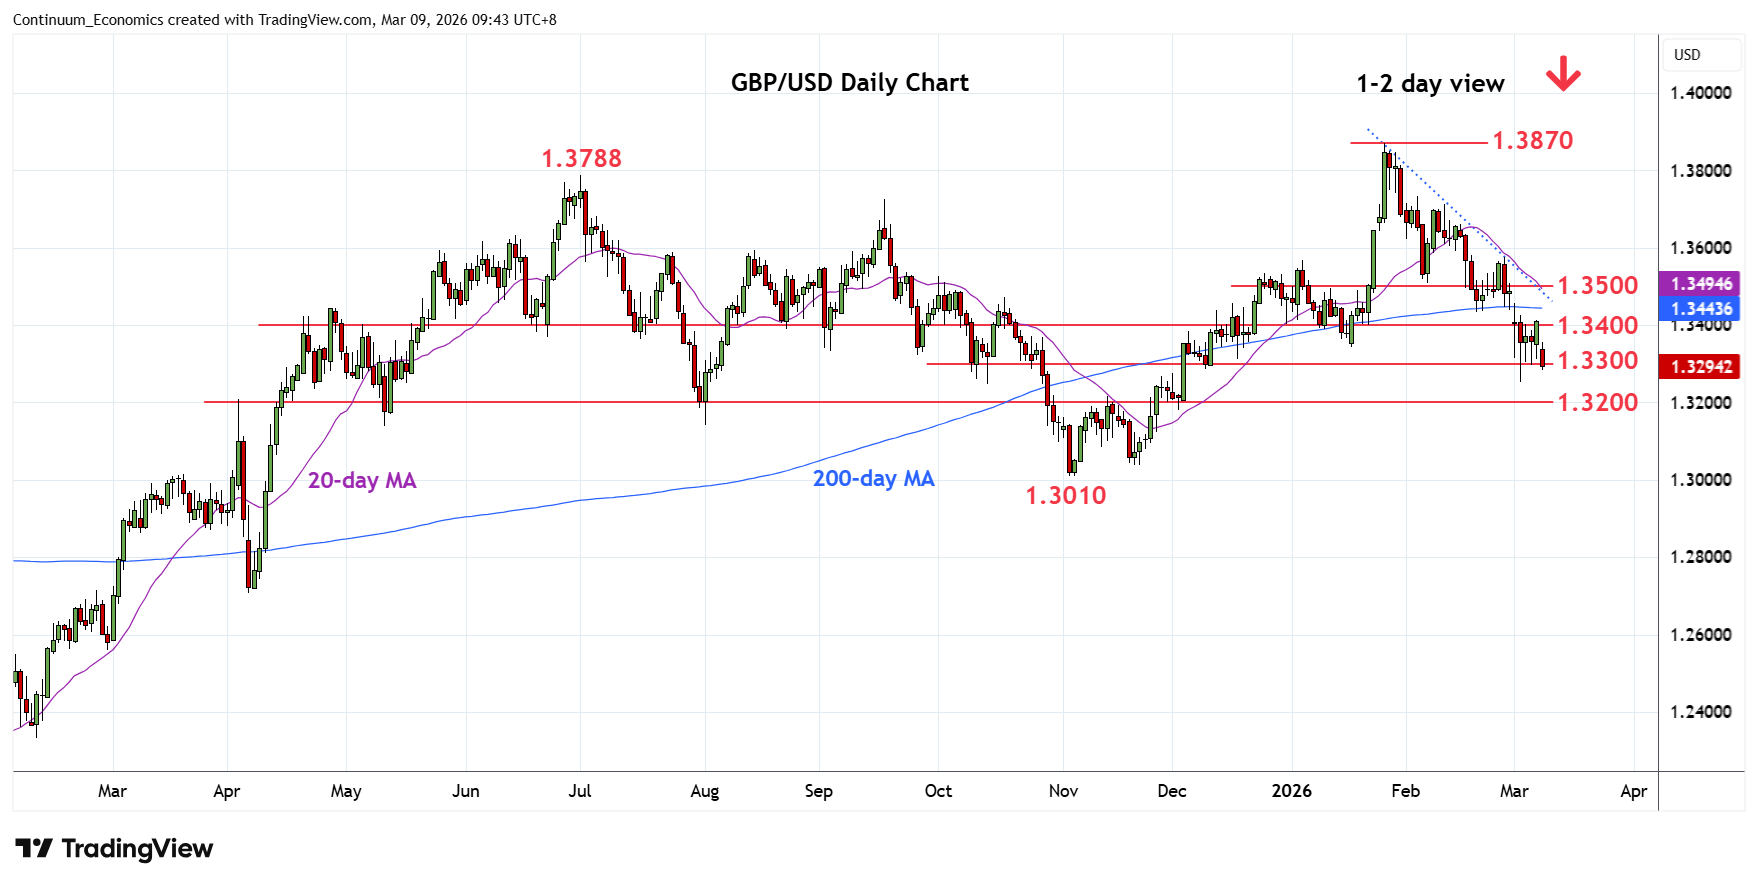
Weak start to break the 1.3300 level see room for extension to retest the 1.3253 low of last week
| Level | Comment | Level | Comment | |||||
|---|---|---|---|---|---|---|---|---|
| R4 | 1.3575 | ** | 26 Feb high | S1 | 1.3300 | * | congestion | |
| R3 | 1.3500/10 | ** | congestion, 6 Feb low | S2 | 1.3253 | ** | 3 Mar YTD low | |
| R2 | 1.3435 | * | 19 Feb low | S3 | 1.3215 | * | 76.4% Nov/Jan rally | |
| R1 | 1.3400 | * | congestion | S4 | 1.3200 | * | congestion |
Asterisk denotes strength of level
01:45 GMT - Weak start to break the 1.3300 level see room for extension to retest the 1.3253 low of last week. Negative daily and weekly studies keep pressure firmly on the downside and threatens break here to further retrace the November/January rally to target the 1.3215, 76.4% Fibonacci level. Lower still, will see room for retest of the 1.3200 level. Meanwhile, resistance remains at the 1.3400 congestion which extend to the 1.3435 low of 19 February. This area now expected to cap and sustain losses from the 1.3870, January current year high.