Published: 2026-01-02T06:30:55.000Z
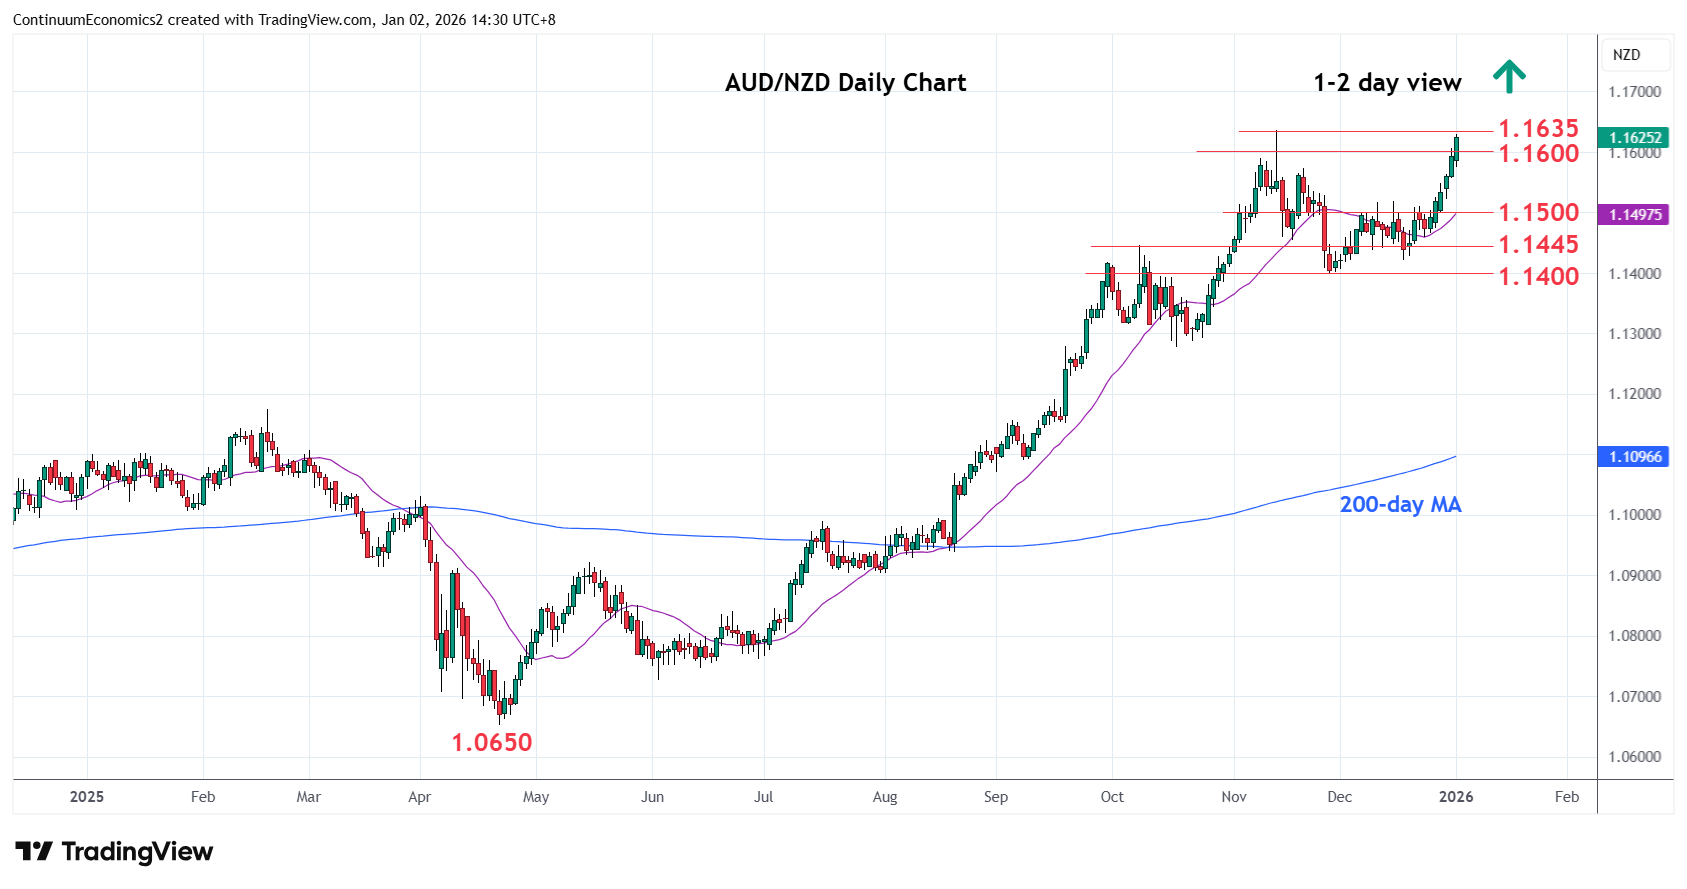
Chart AUD/NZD Update: Retest 1.1635 high
-
Break of the 1.1600 level see prices extending gains from the 1.1420/1.1400 December/November lows
| Level | Comment | Level | Comment | |||||
|---|---|---|---|---|---|---|---|---|
| R4 | 1.1750 | * | Jun 2013 low | S1 | 1.1550 | * | congestion | |
| R3 | 1.1700 | * | congestion | S2 | 1.1500 | * | congestion | |
| R2 | 1.1660 | * | Sep 2013 high | S3 | 1.1445 | * | Nov high | |
| R1 | 1.1635 | ** | 13 Nov 2025 year high | S4 | 1.1420/00 | ** | 17 Dec, Nov lows |
Asterisk denotes strength of level
06:20 GMT - Break of the 1.1600 level see prices extending gains from the 1.1420/1.1400 December/November lows to retest the 1.1635, 2025 year high. Reaction here can be expected to unwind overbought intraday and daily studies. However, bullish structure suggest potential for break to further extend gains from the April 2025 year low. Higher, will see room to resistance at 1.1660 and the 1.1700/50 area. Meanwhile, support is raised to the 1.1550/1.1500 congestion area which is expected to underpin. Only below here will fade the upside pressure and see room for deeper pullback.