Published: 2025-02-27T07:57:04.000Z
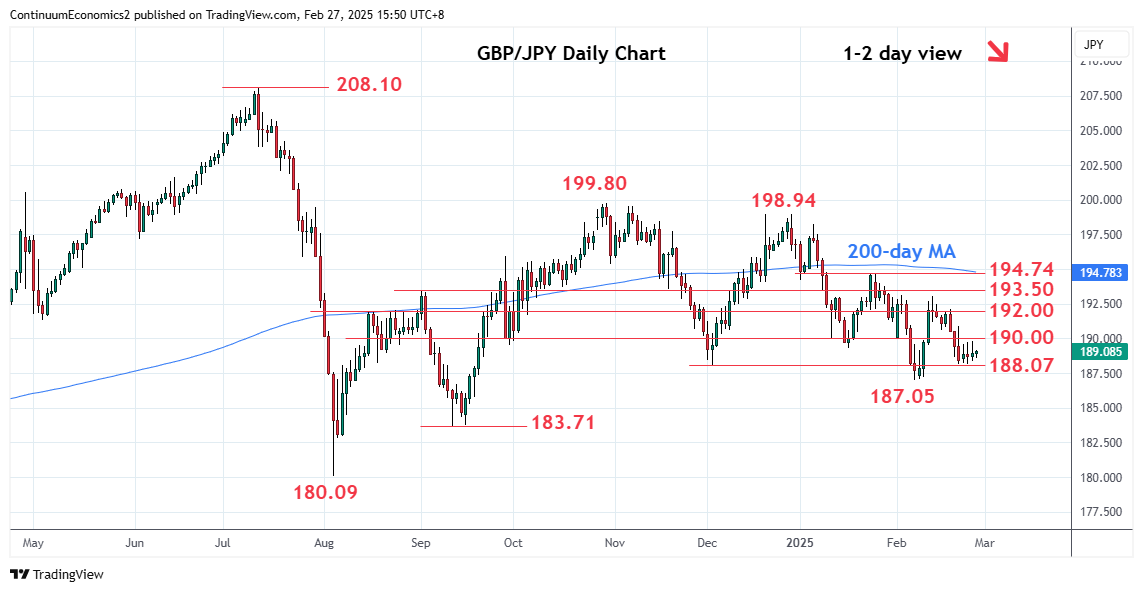
Chart GBP/JPY Update: Range-bound above 188.07 support

Technical Analyst
-
No change, with prices confined within a narrow range above the 188.07 support
| Levels | Imp | Comment | Levels | Imp | Comment | |||
|---|---|---|---|---|---|---|---|---|
| R4 | 193.04 | ** | 13 Feb high | S1 | 188.07 | * | Dec low | |
| R3 | 192.00 | * | congestion | S2 | 187.05 | ** | 7 Feb YTD low | |
| R2 | 191.00 | * | congestion | S3 | 185.00 | * | congestion | |
| R1 | 190.00 | * | congestion | S4 | 183.71 | ** | Sep low |
Asterisk denotes strength of level
08:00 GMT - No change, with prices confined within a narrow range above the 188.07 support. Consolidation see prices unwinding the oversold intraday studies with the resulting flag pattern highlighting risk for break here to extend losses from the 193.04, 13 February high. Lower will open the February YTD low at 187.05 to retest. Below this will extend the broader losses from the October high to target the 185.00 congestion then the 183.71, September low. Meanwhile, resistance remain at the 190.00 congestion which is expected to cap and sustain losses from resistance at the 193.04 high.