Chart GBP/USD Update: Consolidating
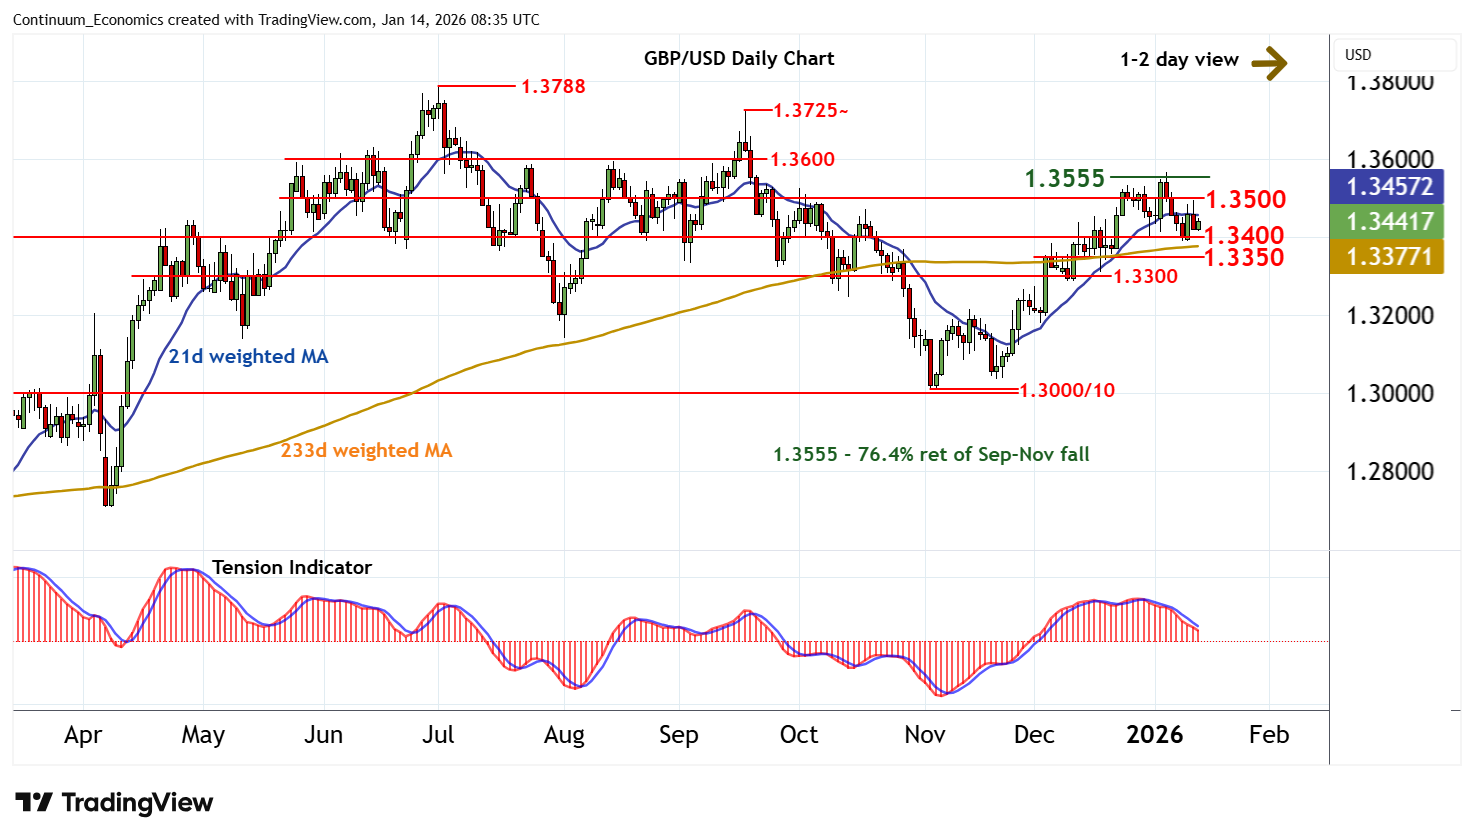
The anticipated move towards congestion resistance at 1.3500 has met selling interest around 1.3495
| Level | Comment | Level | Comment | |||||
|---|---|---|---|---|---|---|---|---|
| R4 | 1.3650 | congestion | S1 | 1.3400 | * | congestion | ||
| R3 | 1.3600 | * | congestion | S2 | 1.3350 | * | congestion lows | |
| R2 | 1.3555 | ** | 76.4% ret of Sep-Nov fall | S3 | 1.3300 | * | congestion | |
| R1 | 1.3500 | * | congestion | S4 | 1.3200 | ** | break level |
Asterisk denotes strength of level
08:10 GMT - The anticipated move towards congestion resistance at 1.3500 has met selling interest around 1.3495, with steady losses bouncing from above congestion support at 1.3400 to currently trade around 1.3440. Oversold daily stochastics are rising, suggesting consolidation. But the negative daily Tension Indicator highlights potential for a test below 1.3400 towards congestion lows around 1.3350, where mixed weekly charts could prompt fresh consolidation. Meanwhile, resistance remains at 1.3500. However, a close above the 1.3555 Fibonacci retracement, if seen, will turn sentiment positive and extend November gains initially towards congestion around 1.3600.