Published: 2026-02-26T01:12:52.000Z
Chart USD/JPY Update: Lower in consolidation below 157.00
2
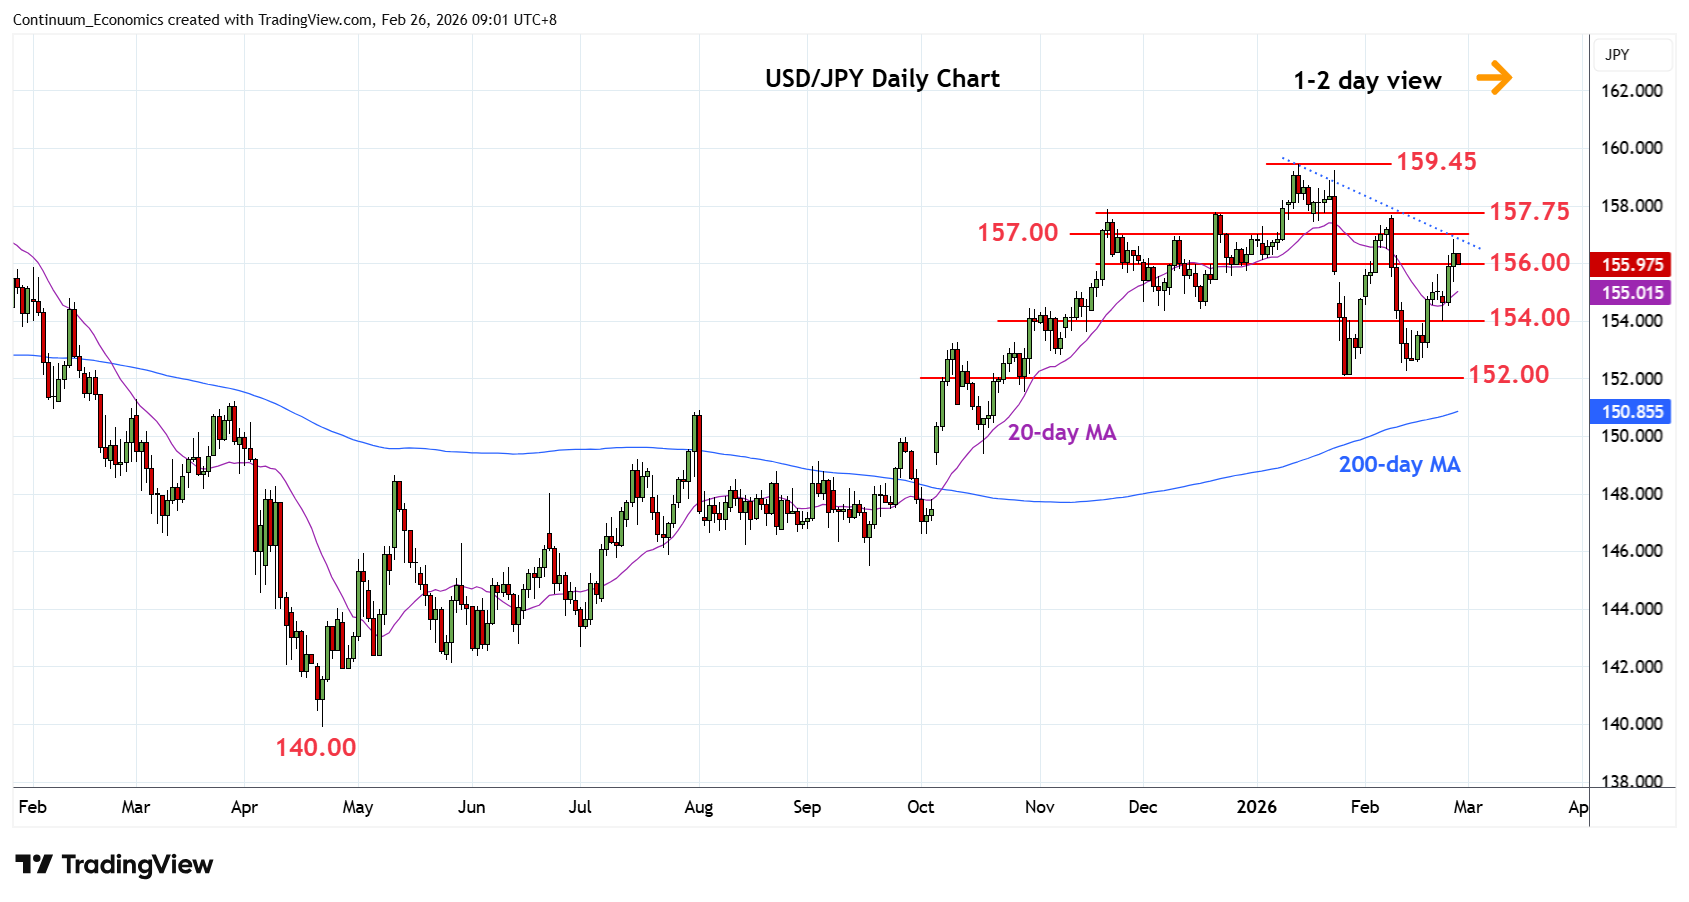
Break above 156.00 level has met with selling pressure below the 157.00 resistance
| Levels | Imp | Comment | Levels | Imp | Comment | |||
|---|---|---|---|---|---|---|---|---|
| R4 | 158.87 | ** | Jan 2025 yr high | S1 | 155.00 | * | congestion | |
| R3 | 157.75/90 | ** | Dec, Nov highs | S2 | 154.00 | * | 23 Feb low | |
| R2 | 157.65 | * | 9 Feb high | S3 | 153.00 | * | congestion | |
| R1 | 157.00 | * | congestion | S4 | 152.10 | ** | 27 Jan YTD low |
Asterisk denotes strength of level
01:00 GMT - Break above 156.00 level has met with selling pressure below the 157.00 resistance as prices unwind overbought intraday studies. Daily studies are still positive but overbought reading caution corrective pullback. Gains above the 157.00 level should see strong resistance starting at 157.65 and extending to the 157.75/90 area expected to cap. Meanwhile, support is raised to the 155.00 congestion and see break here needed to fade the upside pressure and see consolidation back to support at the 154.00 level.