Published: 2025-03-19T08:45:37.000Z
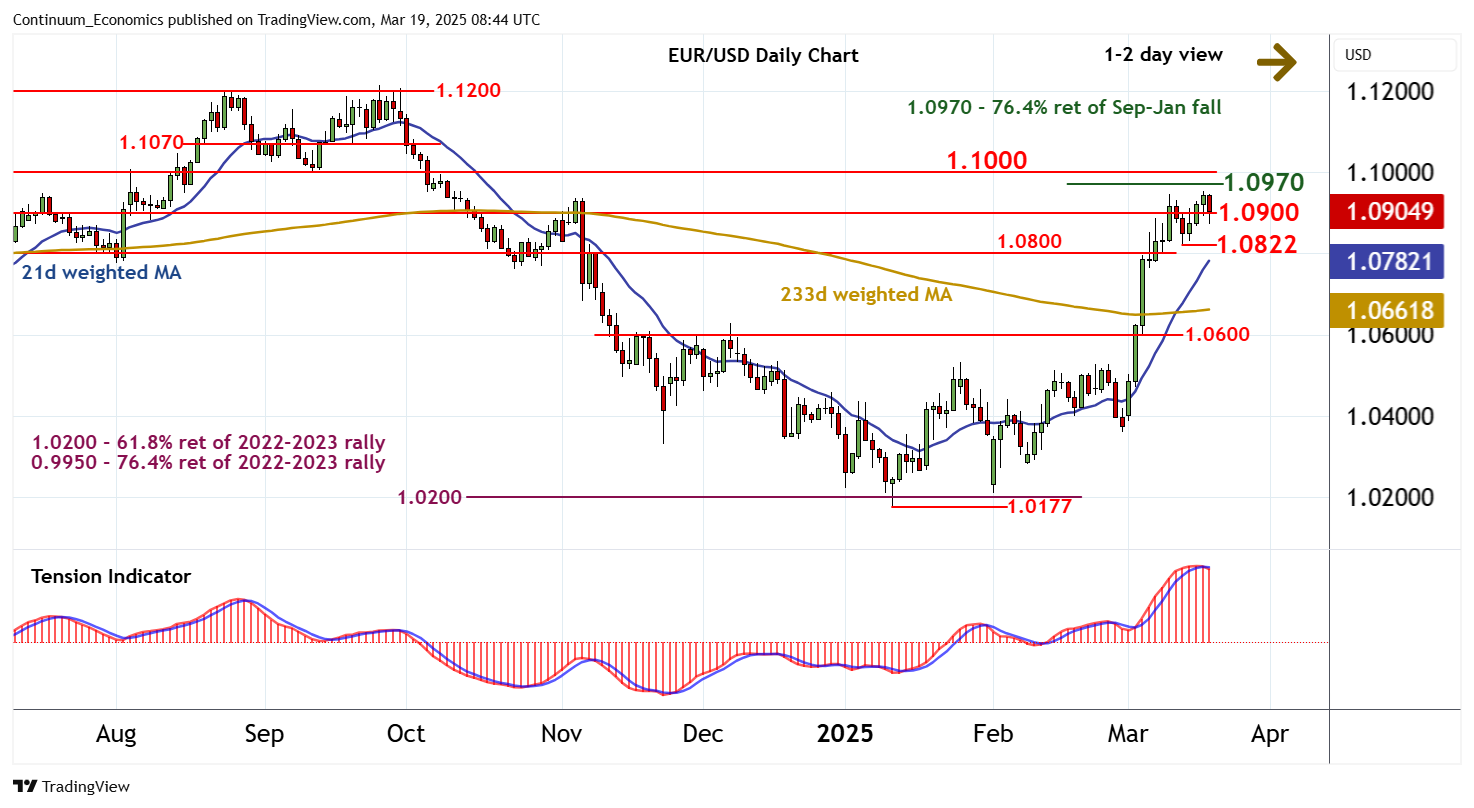
Chart EUR/USD Update: Turning away from the 1.0970 Fibonacci retracement

Senior Technical Strategist
1

Consolidation beneath strong resistance at the 1.0970 Fibonacci retracement is giving way to a pullback

| Levels | Imp | Comment | Levels | Imp | Comment | |||
|---|---|---|---|---|---|---|---|---|
| R4 | 1.1070 | ** | break level | S1 | 1.0900 | * | break level | |
| 14 | 1.1000 | ** | break level | S2 | 1.0822 | * | 13 Mar low | |
| R2 | 1.0970 | ** | 76.4% ret of Sep-Jan fall | S3 | 1.0800 | * | break level | |
| R1 | 1.0954 | 18 Mar YTD high | S4 | 1.0765 | * | 6 Mar low |
Asterisk denotes strength of level
08:35 GMT - Consolidation beneath strong resistance at the 1.0970 Fibonacci retracement is giving way to a pullback, as intraday studies turn down, with prices currently trading just above support at 1.0900. Overbought daily stochastics are flat and the daily Tension Indicator is also turning down, highlighting room for a test beneath here. Focus will then turn to the 1.0822 low of 13 March. But rising weekly charts are expected to limit any tests in renewed buying interest/consolidation. Following cautious trade, a break above 1.0970 is looked for, extending January gains initially towards 1.1000. Beyond here is 1.1070.