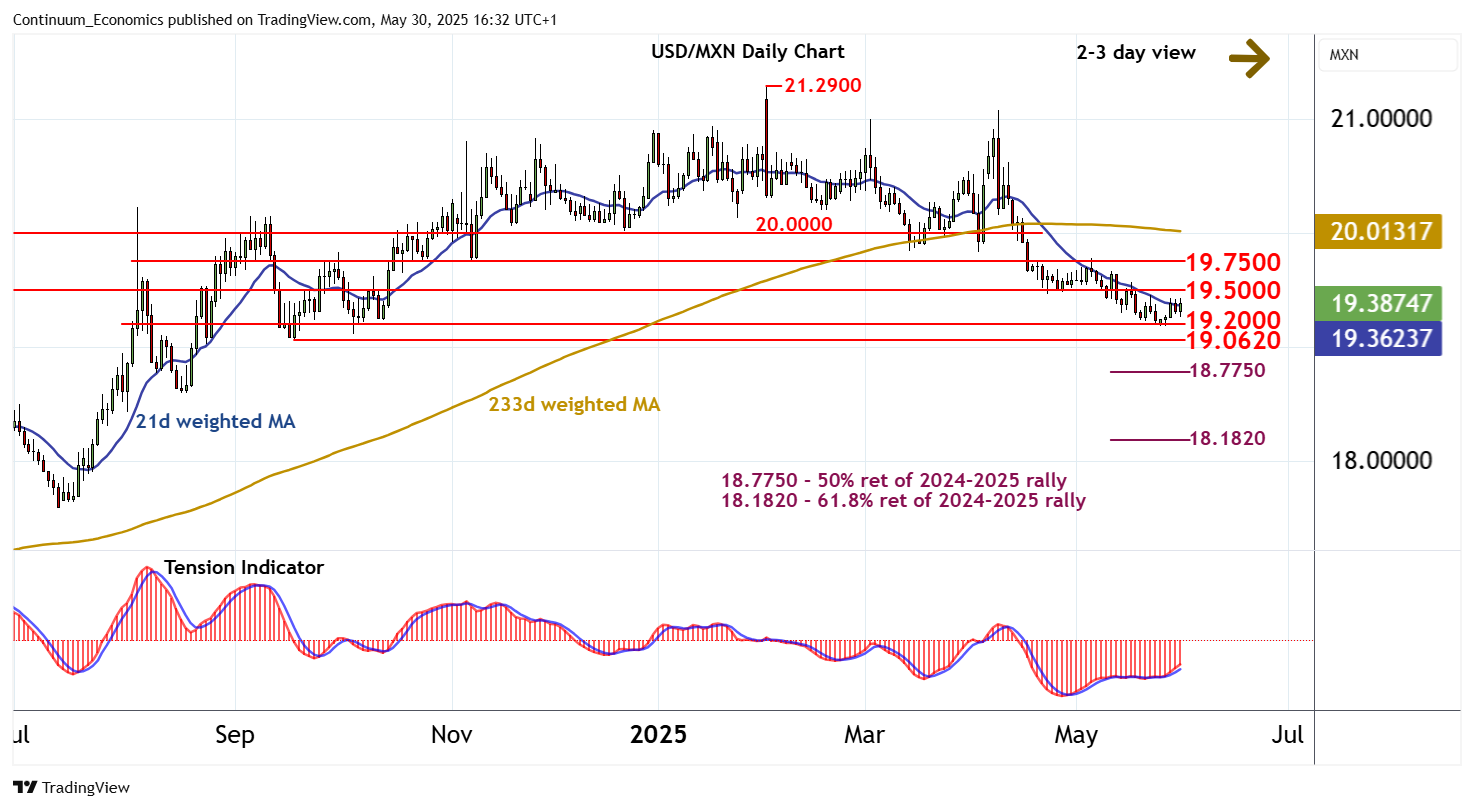
Chart USD/MXN Update: Extending consolidation - any gains to remain limited

Little change, as prices extend consolidation above congestion support at 19.2000
| Levels | Imp | Comment | Levels | Imp | Comment | |||
|---|---|---|---|---|---|---|---|---|
| R4 | 20.0000 | ** | break level | S1 | 19.2000 | * | congestion | |
| R3 | 19.7800 | * | 6 May high | S2 | 19.0620 | * | 18 Sep (m) low | |
| R2 | 19.7000 | * | congestion | S3 | 19.0000 | ** | congestion | |
| R1 | 19.5000 | * | congestion | S4 | 18.7750 | ** | 50% ret of 2024-2025 rally |
Asterisk denotes strength of level
16:20 BST - Little change, as prices extend consolidation above congestion support at 19.2000. Daily readings have ticked higher and oversold weekly stochastics are unwinding, suggesting an improvement in sentiment and room for a test of congestion resistance at 19.5000. But the bearish weekly Tension Indicator and negative longer-term charts should limit any break above here in renewed selling interest beneath 19.7000. Following cautious trade, fresh losses are looked for. A break below 19.2000 will add weight to sentiment and extend February losses initially to the 19.0620 monthly low of 18 September. A further close beneath here will confirm a more significant bear trend, as focus then turns to the 18.7750 Fibonacci retracement.