Published: 2025-04-07T00:25:53.000Z
Chart AUD/USD Update: Under pressure

Technical Analyst
-
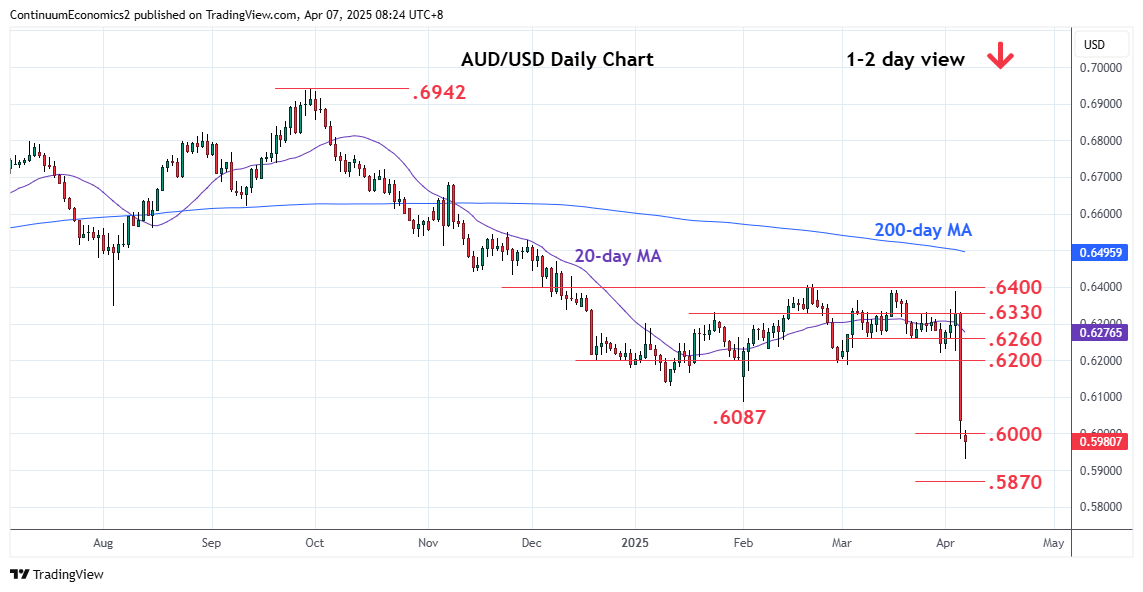
Weak opening see prices extending sharp losses from the .6330/.6400 resistance last week
| Levels | Imp | Comment | Levels | Imp | Comment | |||
|---|---|---|---|---|---|---|---|---|
| R4 | 0.6260 | * | congestion | S1 | 0.5930 | intraday low | ||
| R3 | 0.6200 | ** | congestion | S2 | 0.5870 | * | 26 Mar 2020 low | |
| R2 | 0.6131 | * | Jan low | S3 | 0.5510 | ** | Mar 2020 multi-year low | |
| R1 | 0.6000/87 | * | congestion, Feb low | S4 | 0.5400 | * | Oct 2002 low |
Asterisk denotes strength of level
00:10 GMT - Weak opening see prices extending sharp losses from the .6330/.6400 resistance last week with break of the .6000 level reaching fresh multi-year low at .5930. Pressure remains on the downside and lower will see room for extension to support at .5870 though potential is for losses to retest the March 2020 low at .5510. Meanwhile, resistance is lowered to the .6000 figure and this extend to the .6087 February low. This area now expected to cap and regaining this needed to ease the downside pressure and open up room for stronger bounce to the .6200 congestion.