Published: 2023-12-06T17:22:51.000Z
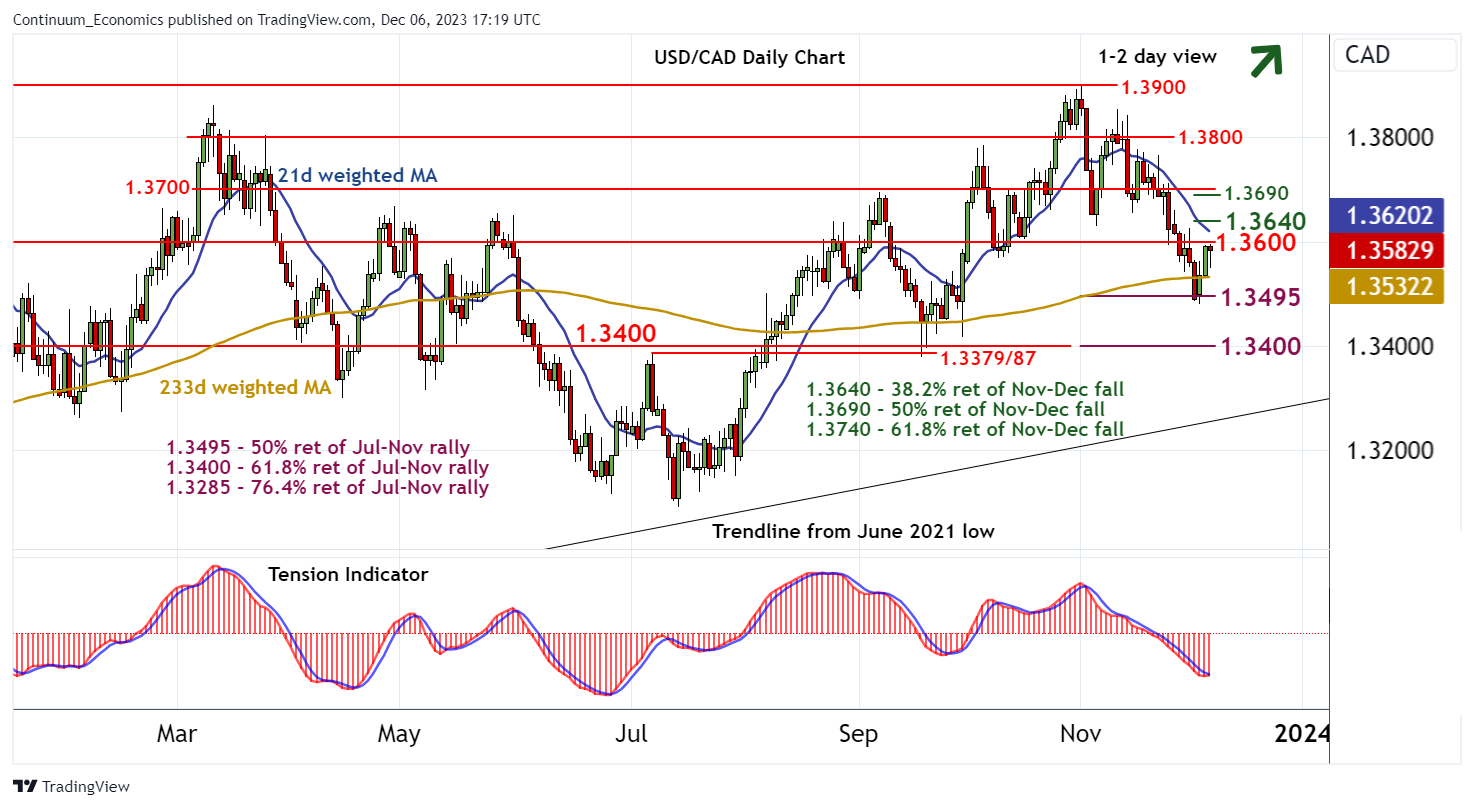
Chart USD/CAD Update: Limited scope above 1.3600
-

| Levels | Imp | Comment | Levels | Imp | Comment | |||
|---|---|---|---|---|---|---|---|---|
| R4 | 1.3740 | ** | 61.8% ret of Nov-Dec fall | S1 | 1.3495/00 | ** | 50% ret; cong | |
| R3 | 1.3690/00 | ** | 50% ret; break level | S2 | 1.3480 | 4 Dec low | ||
| R2 | 1.3640 | ** | 38.2% ret of Nov-Dec fall | S3 | 1.3400 | ** | 61.8% ret; cong | |
| R1 | 1.3600 | * | congestion | S4 | 1.3379/87 | ** | Jul-Sep pivot |
17:05 GMT - Little change, as mixed/negative intraday studies keep short-term sentiment cautious and extend consolidation around congestion resistance at 1.3600. Oversold daily stochastics are unwinding and the bearish daily Tension Indicator is flattening, suggesting potential for a test above here, with focus to then turn to the 1.3640 Fibonacci retracement. Negative weekly charts, however, could limit any initial tests in fresh range trade. Following corrective gains, November losses are expected to resume. However, a close below 1.3495/00 is needed to turn price action negative and open up strong support at 1.3400.