Published: 2026-05-13T00:56:08.000Z
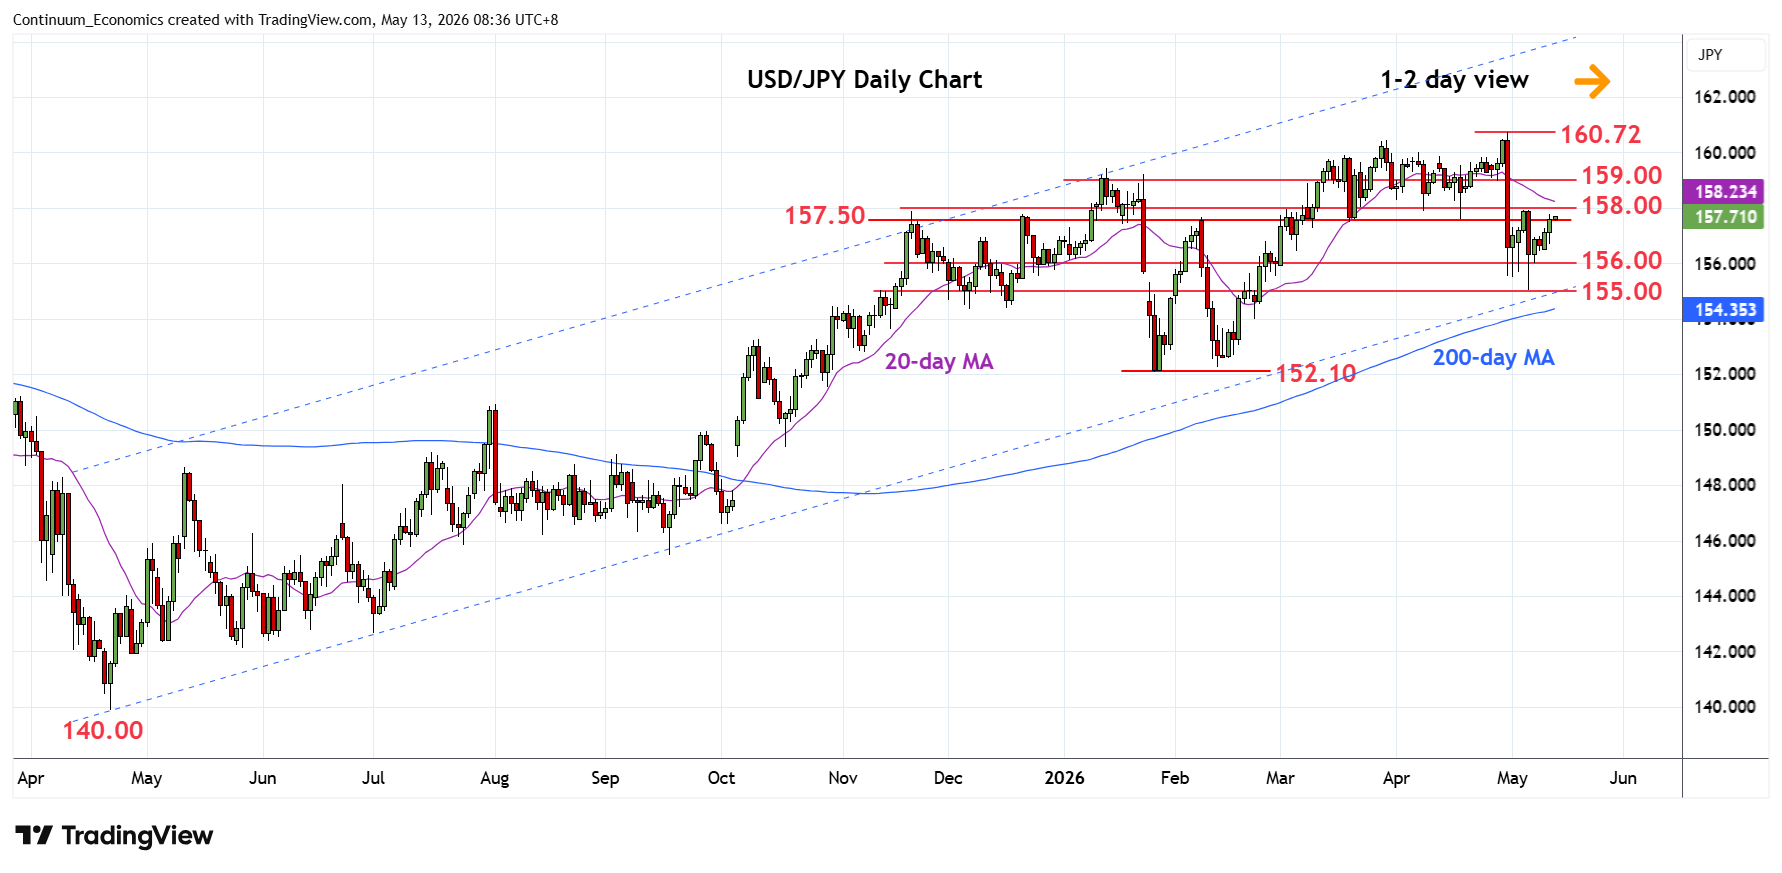
Chart USD/JPY Update: Within reach of 158.00 resistance
1
Tracking higher as prices extend steady gains from the 155.00 spike low to retrace losses from 160.72, April current year high
| Levels | Imp | Comment | Levels | Imp | Comment | |||
|---|---|---|---|---|---|---|---|---|
| R4 | 160.00 | * | figure | S1 | 157.00 | * | congestion | |
| R3 | 159.45 | * | Jan high | S2 | 156.00 | * | congestion | |
| R2 | 159.00 | ** | congestion | S3 | 155.02/00 | ** | 6 May low, congestion | |
| R1 | 158.00 | ** | congestion | S4 | 154.35 | * | 200-day MA |
Asterisk denotes strength of level
00:45 GMT - Tracking higher as prices extend steady gains from the 155.00 spike low to retrace losses from 160.72, April current year high. Break above the 157.50 resistance turn focus to strong resistance at the 158.00 congestion which is expected to cap and give way to renewed selling pressure later. Meanwhile, support remains at the 157.00/156.00 congestion area and break here is needed to open up room for retest the 155.00 low. Below the latter will extend the April losses to retrace gains from the 152.10 January current year low 154.35/00, 200-day MA and congestion area.