Chart EUR/CAD Update: Pressuring year highs
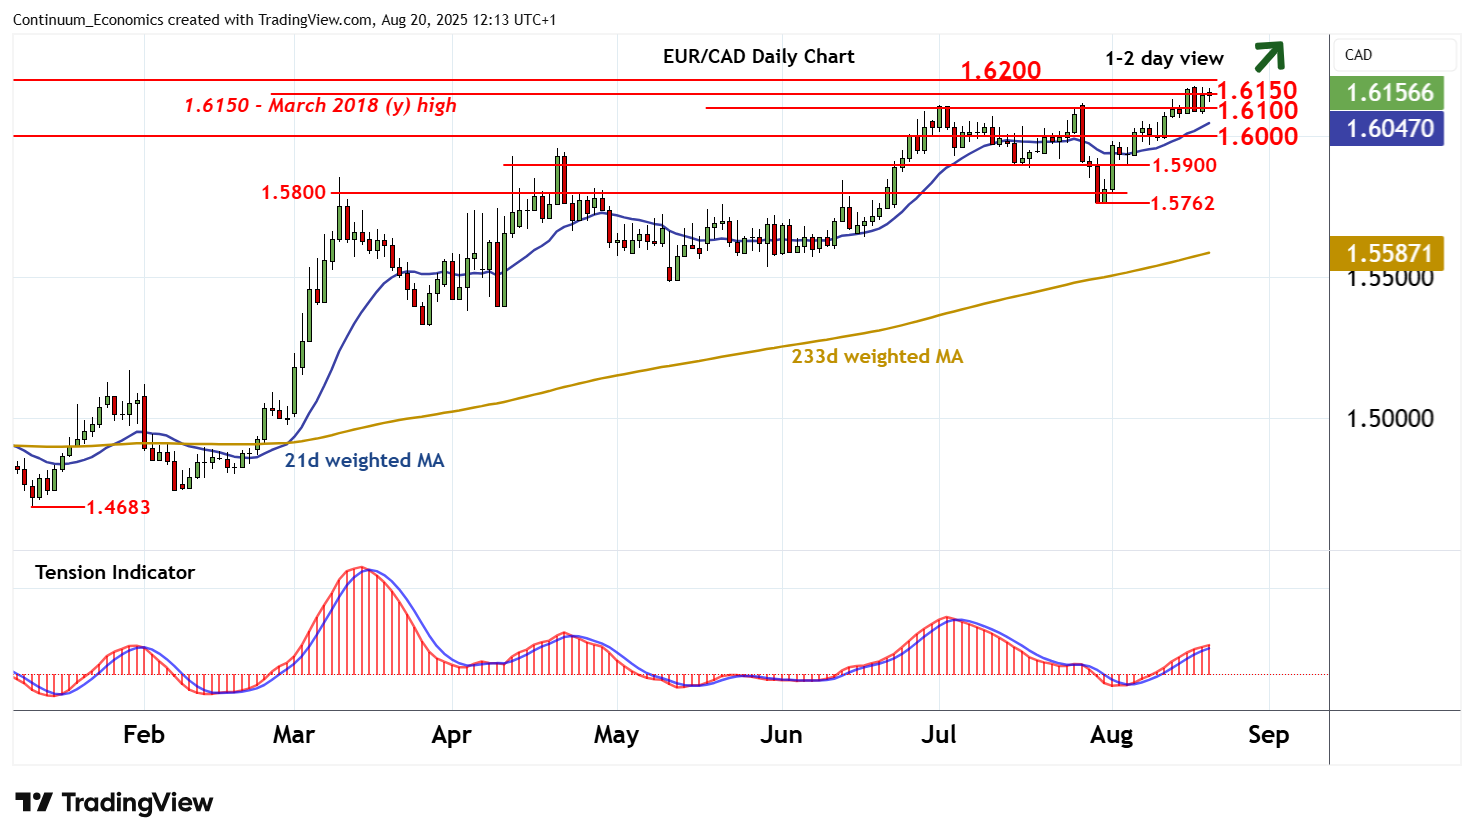
Little change, as prices extend pressure on critical resistance at the 1.6150 year high of March 2018 and the 1.6180 current year high of 18 August
| Level | Comment | Level | Comment | |||||
|---|---|---|---|---|---|---|---|---|
| R4 | 1.6235 | ** | 76.4% ret of 2008-2012 fall | S1 | 1.6100 | ** | congestion | |
| R3 | 1.6200 | * | historic congestion | S2 | 1.6000 | ** | congestion | |
| R2 | 1.6180 | * | 18 Aug YTD high | S3 | 1.5900 | congestion | ||
| R1 | 1.6150~ | ** | Mar 18 (y) high | S4 | 1.5800 | congestion |
Asterisk denotes strength
11:50 BST - Little change, as prices extend pressure on critical resistance at the 1.6150 year high of March 2018 and the 1.6180 current year high of 18 August in CAD-driven trade. Overbought daily stochastics are unwinding, suggesting potential for further consolidation. But the rising daily Tension Indicator and positive weekly charts highlight room for a later break and extension of 2022 gains towards the 1.6235 Fibonacci retracement. Meanwhile, support remains at congestion around 1.6100. A close beneath here, if seen, will add weight to sentiment and open up further congestion around 1.6000. Any tests should give way to fresh buying interest/consolidation.