Chart EUR/PLN Update: Poised for further losses

Cautious trade is giving way to fresh selling interest
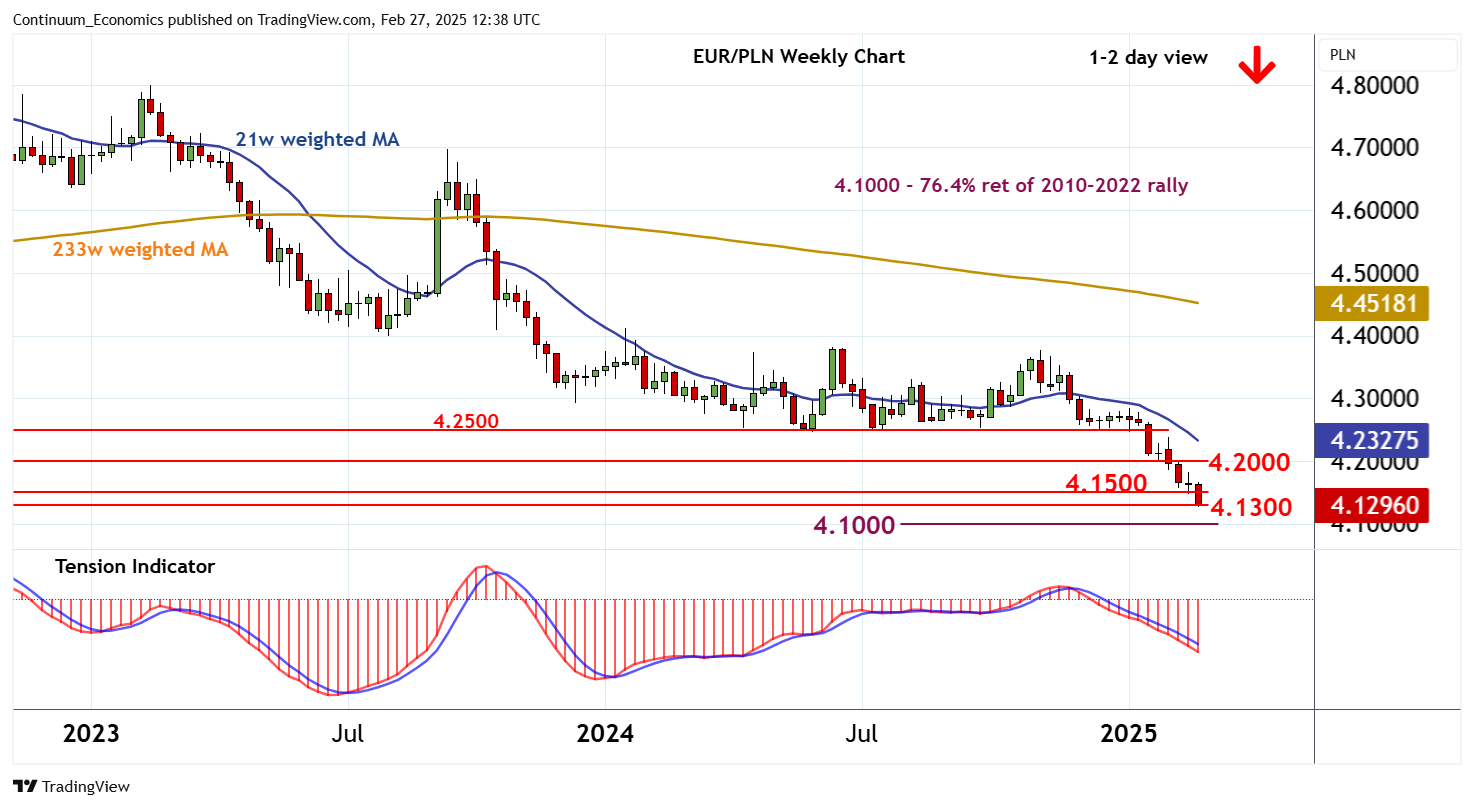
| Levels | Imp | Comment | Levels | Imp | Comment | |||
| R4 | 4.2200 | * | break level | S1 | 4.1300 | ** | January 2018 (y) low | |
| R3 | 4.2000 | ** | January 2020 (y) low, figure | S2 | 4.1000 | ** | 76.4% ret of 2010-2022 rally | |
| R2 | 4.1800 | break level | S3 | 4.0150 | * | May 2015 low | ||
| R1 | 4.1500 | * | April 2018 low | S4 | 4.0000 | * | figure |
Asterisk denotes strength of level
12:15 GMT - Cautious trade is giving way to fresh selling interest, as intraday studies turn down, with prices once again pressuring strong support at the 4.1300 year low of January 2018. Daily readings continue to track lower and broader weekly charts are also negative, highlighting a bearish tone and room for still deeper losses in the coming sessions. A break beneath here will extend March 2022 losses towards the 4.1000 Fibonacci retracement. But already oversold weekly stochastics are expected to limit any initial tests in short-covering/consolidation. Meanwhile, resistance remains at 4.1500. A close above here would turn sentiment neutral and prompt consolidation beneath the 4.1800 break level.