Published: 2026-04-28T07:34:10.000Z
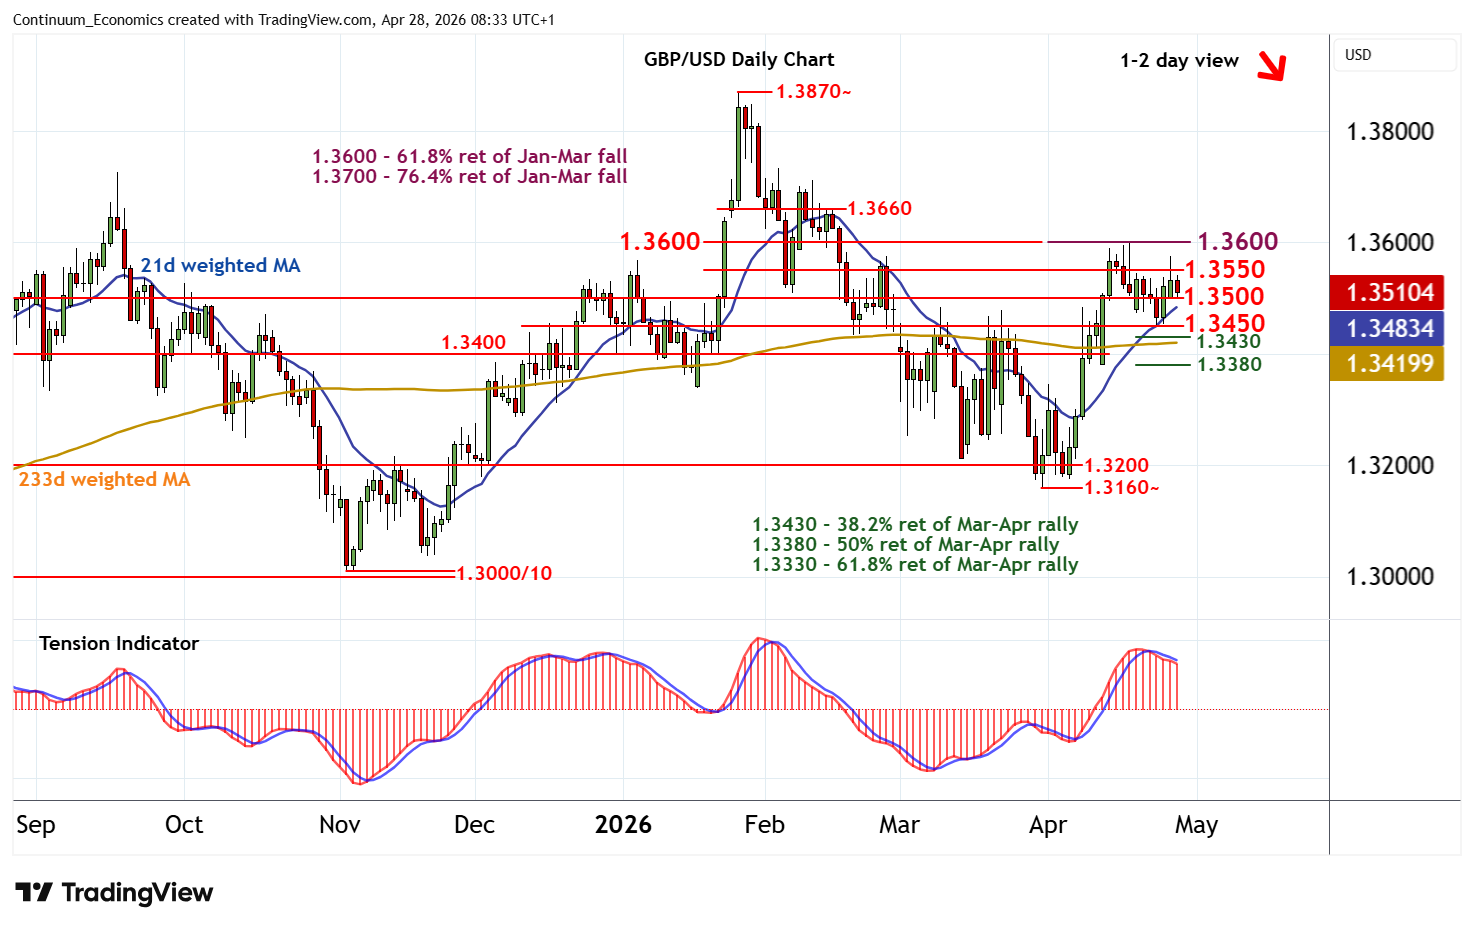
Chart GBP/USD Update: Leaning lower
2
The anticipated test above congestion resistance at 1.3550 has been pushed back from 1.3575
| Level | Comment | Level | Comment | |||||
|---|---|---|---|---|---|---|---|---|
| R4 | 1.3700 | ** | 76.4% ret of Jan-Mar fall | S1 | 1.3500 | ** | congestion | |
| R3 | 1.3660 | * | congestion | S2 | 1.3450 | break level | ||
| R2 | 1.3600 | ** | congestion; 61.8% ret | S3 | 1.3430 | * | 38.2% ret of Mar-Apr rally | |
| R1 | 1.3550 | * | congestion | S4 | 1.3400 | ** | congestion |
Asterisk denotes strength of level
08:10 BST - The anticipated test above congestion resistance at 1.3550 has been pushed back from 1.3575, as overbought intraday studies unwind, with prices approaching congestion support at 1.3500. Daily stochastics and the daily Tension Indicator continue to fall, highlighting room for a test beneath here. Focus will then turn to 1.3450. But mixed/positive weekly charts should limit any initial tests in renewed consolidation. Meanwhile, resistance remains at 1.3550 and extends to 1.3600. A close above here is needed to turn sentiment positive and extend late-March gains initially towards congestion around 1.3660.