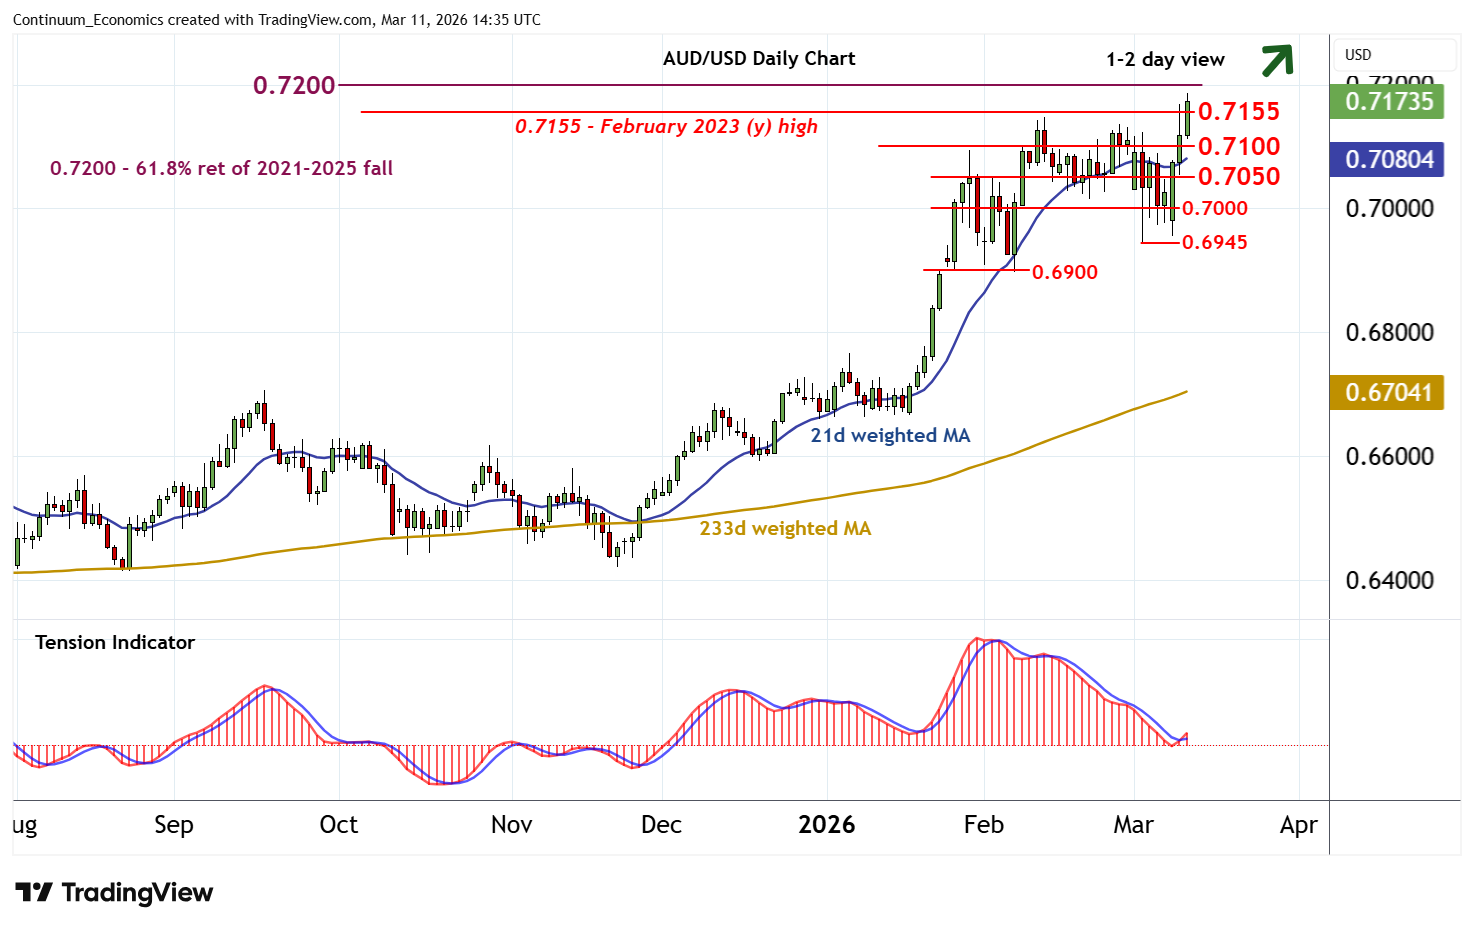
Chart AUD/USD Update: Fresh year highs - strong resistance at the 0.7200 Fibonacci retracement
Cautious trade above 0.7050 has given way to a test above strong resistance at the 0.7155~ year high of February 2023
| Levels | Imp | Comment | Levels | Imp | Comment | |||
|---|---|---|---|---|---|---|---|---|
| R4 | 0.7300 | historic congestion | S1 | 0.7100 | break level | |||
| R3 | 0.7280~ | ** | June 2022 high | S2 | 0.7050 | * | congestion | |
| R2 | 0.7200 | ** | 61.8% ret of 2021-2025 fall | S3 | 0.7000 | * | congestion | |
| R1 | 0.7155~ | ** | Feb 2023 (y) high | S4 | 0.6900 | ** | break level |
Asterisk denotes strength of level
14:30 GMT - Cautious trade above 0.7050 has given way to a test above strong resistance at the 0.7155~ year high of February 2023, with price action currently choppy around 0.7175. Daily readings are rising, suggesting room for continuation towards resistance at the 0.7200 multi-year Fibonacci retracement. But negative weekly charts highlight risk of profit-taking/consolidation towards here, before mixed/positive longer-term charts prompt a break. A close above this strong 0.7155~ - 0.7200 range is needed to turn sentiment positive and confirm continuation of April 2025 gains. Meanwhile, support remains at the 0.7100 break level and extends to congestion around 0.7050. This range should underpin any immediate setbacks.