Published: 2026-03-26T00:40:29.000Z
Chart NZD/USD Update: Leaning lower
1
Leaning lower as consolidation around .5850 turn down to pressure the .5800 level
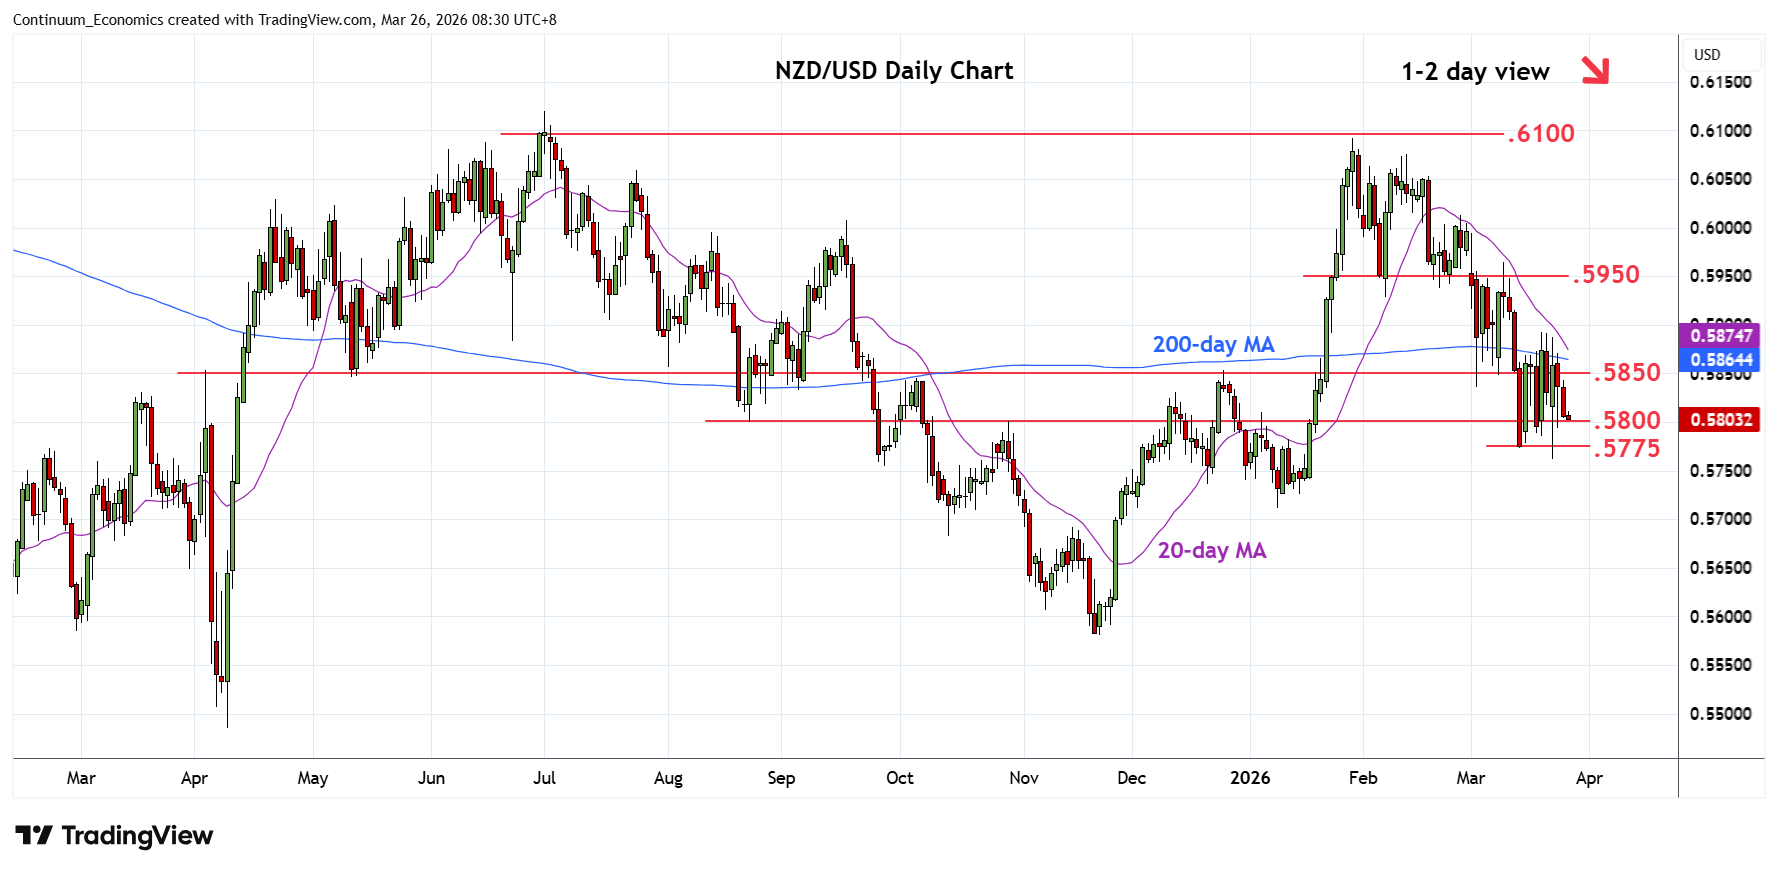
| Levels | Imp | Comment | Levels | Imp | Comment | |||
|---|---|---|---|---|---|---|---|---|
| R4 | .5930/50 | ** | 6 Feb low, congestion | S1 | .5800 | * | congestion | |
| R3 | .5900 | * | congestion | S2 | .5775 | * | 61.8% Nov/Jan rally | |
| R2 | .5892 | * | 19 Mar high | S3 | .5762 | * | 23 Mar low | |
| R1 | .5850 | * | congestion | S4 | .5710/00 | ** | 9 Jan YTD low, 76.4% |
Asterisk denotes strength of level
00:35 GMT - Leaning lower as consolidation around .5850 turn down to pressure the .5800 level. Daily and weekly studies are tracking lower and suggest scope for break here to open the .5775 and .5762 lows to retest. Break here will further retrace the November/January gains and see room for extension to the .5710/00, 9 January YTD low and 76.4% Fibonacci level. Meanwhile, resistance is lowered to the .5850 congestion and extending to .5892 high of last week. This area is expected to cap and sustain losses from the January high.