Published: 2025-12-23T17:36:41.000Z
Chart USD/CAD Update: Pressuring strong support
1
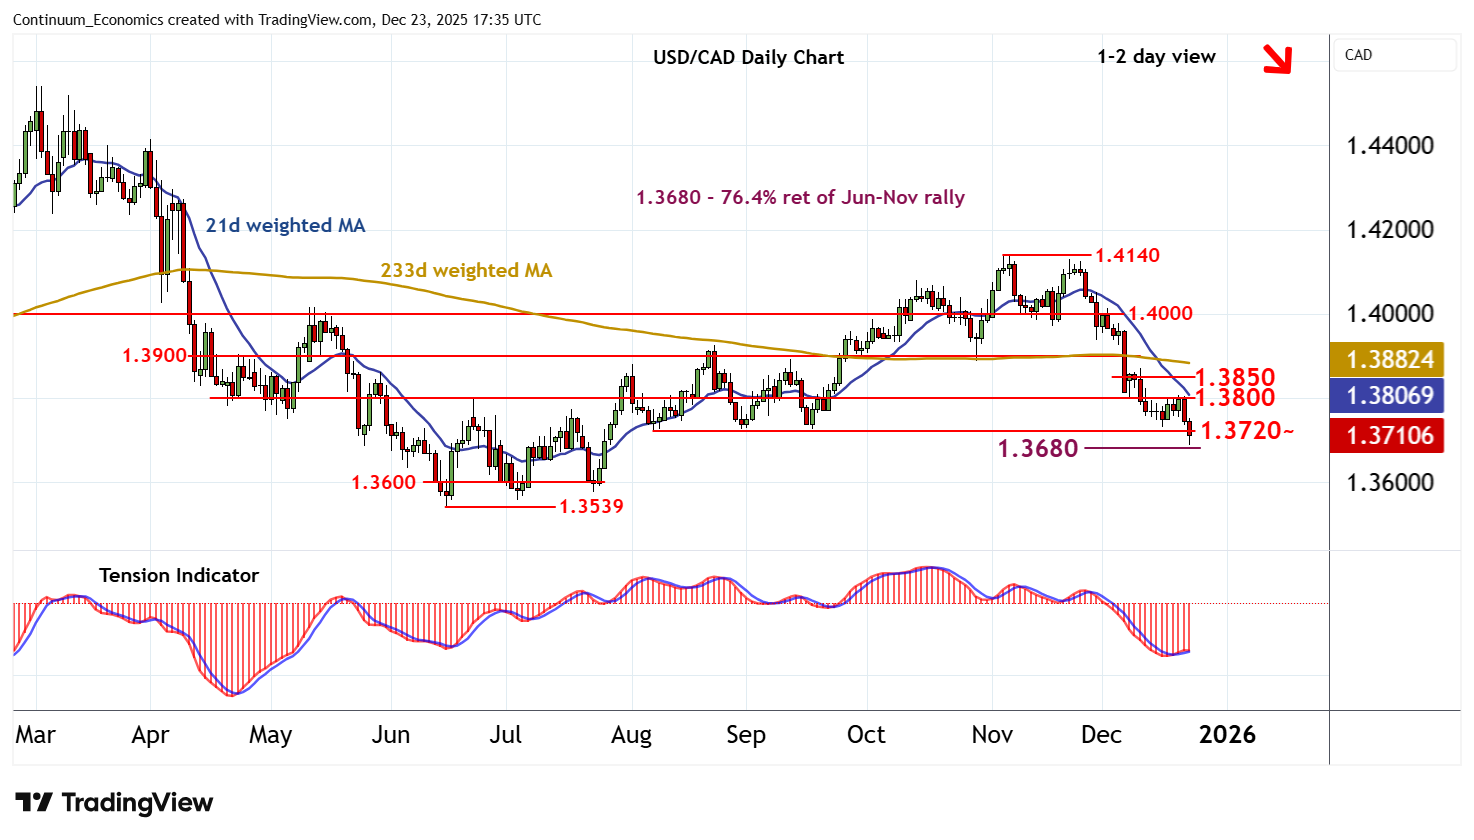
Anticipated losses have reached support within the 1.3680 Fibonacci retracement and the 1.3720~ lows from August-September
| Levels | Imp | Comment | Levels | Imp | Comment | |||
|---|---|---|---|---|---|---|---|---|
| R4 | 1.3950 | * | break level | S1 | 1.3720~ | ** | Aug-Sep lows | |
| R3 | 1.3900 | ** | break level | S2 | 1.3680 | ** | 76.4% ret of Jun-Nov rally | |
| R2 | 1.3850 | congestion | S3 | 1.3600 | * | congestion | ||
| R1 | 1.3800 | ** | congestion | S4 | 1.3539 | ** | 16 Jun YTD low |
Asterisk denotes strength of level
17:00 GMT - Anticipated losses have reached support within the 1.3680 Fibonacci retracement and the 1.3720~ lows from August-September. Mixed intraday studies highlight potential for consolidation within here, before a tick lower in daily readings and negative weekly charts prompt a break. A close below 1.3680 will add weight to sentiment and extend November losses towards congestion around 1.3600. Meanwhile, a close above congestion resistance at 1.3800, if seen, will open up further congestion around 1.3850, where fresh consolidation is expected to appear.