Chart GBP/USD Update: Strong resistance at the 1.3555 Fibonacci retracement
Cautious trade has given way to a sharp break higher
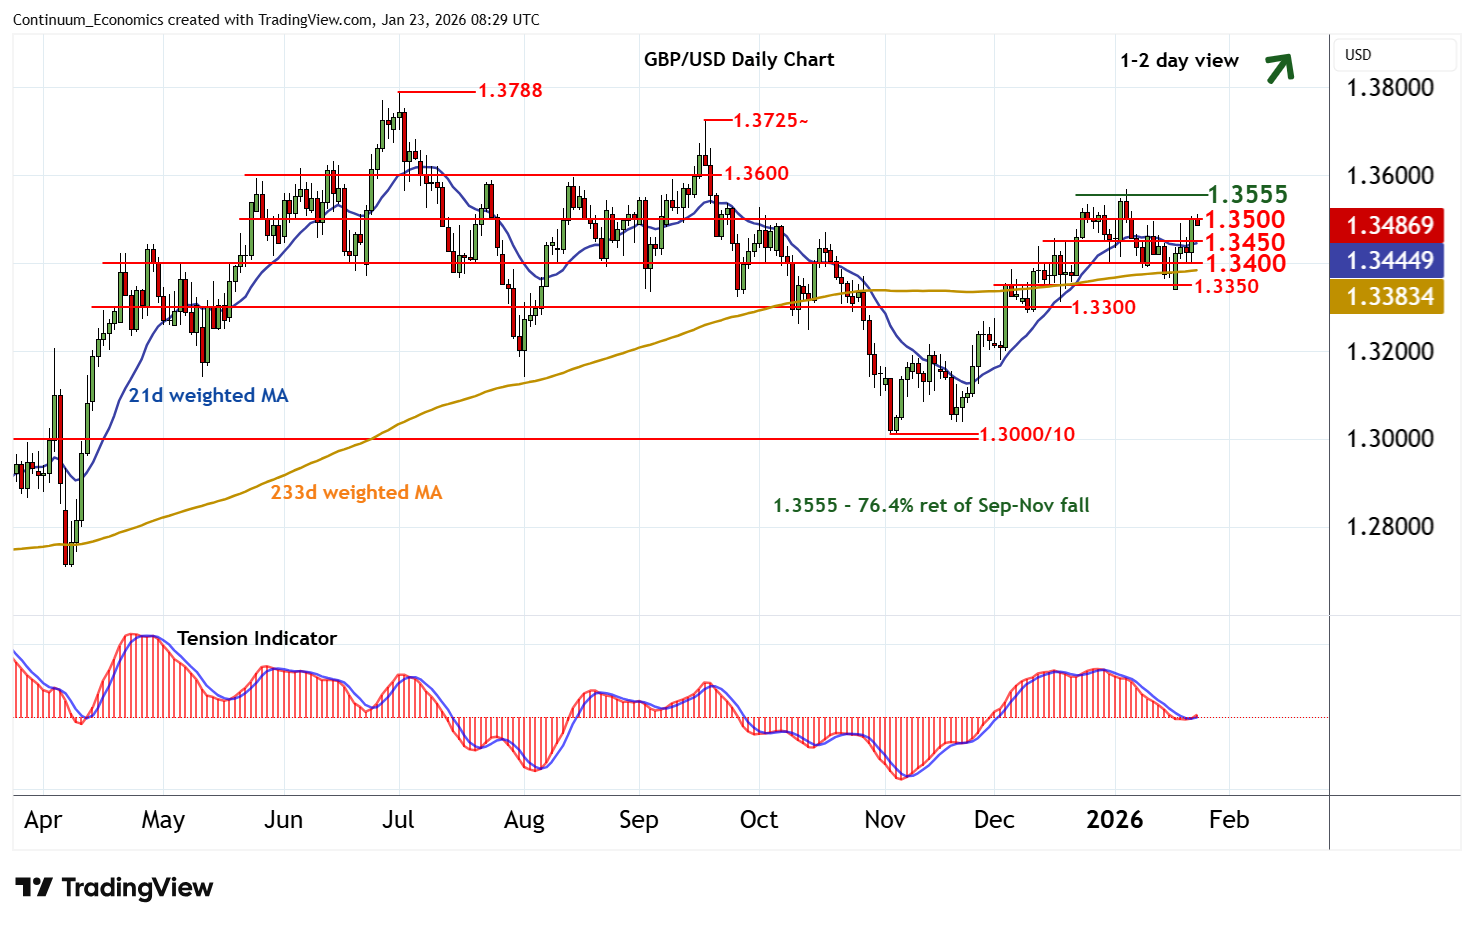
| Level | Comment | Level | Comment | |||||
|---|---|---|---|---|---|---|---|---|
| R4 | 1.3660 | 18 Sep high | S1 | 1.3450 | congestion | |||
| R3 | 1.3600 | ** | congestion | S2 | 1.3400 | * | congestion | |
| R2 | 1.3555 | ** | 76.4% ret of Sep-Nov fall | S3 | 1.3350 | * | congestion lows | |
| R1 | 1.3500 | * | congestion | S4 | 1.3300 | * | congestion |
Asterisk denotes strength of level
08:10 GMT - Cautious trade has given way to a sharp break higher, with prices reaching congestion resistance at 1.3500. Consolidation is developing around here, as overbought intraday studies unwind. But rising daily stochastics and a tick higher in the daily Tension Indicator highlight potential for a further break and extension to strong resistance at the 1.3555 Fibonacci retracement. However, mixed weekly charts are expected to limit any initial tests in profit-taking/consolidation. Meanwhile, support is raised to congestion around 1.3450 and should underpin any immediate setbacks. A close beneath here, if seen, will turn sentiment neutral and give way to consolidation above further congestion around 1.3400.