Published: 2024-12-19T11:05:27.000Z
Chart USD Index DXY Update: Fresh year high - studies improving

Senior Technical Strategist
-

Consolidation has given way to a sharp reactive bounce

| Levels | Imp | Comment | Levels | Imp | Comment | |||
|---|---|---|---|---|---|---|---|---|
| R4 | 110.00 | ** | congestion | S1 | 107.50 | intraday break level | ||
| R3 | 109.00 | ** | 61.8% ret of 2022-2023 fall | S2 | 107.00 | * | break level | |
| R2 | 108.27 | * | 18 Dec YTD high | S3 | 106.50 | ** | congestion | |
| R1 | 108.00 | * | figure | S4 | 106.00 | * | break level |
Asterisk denotes strength of level
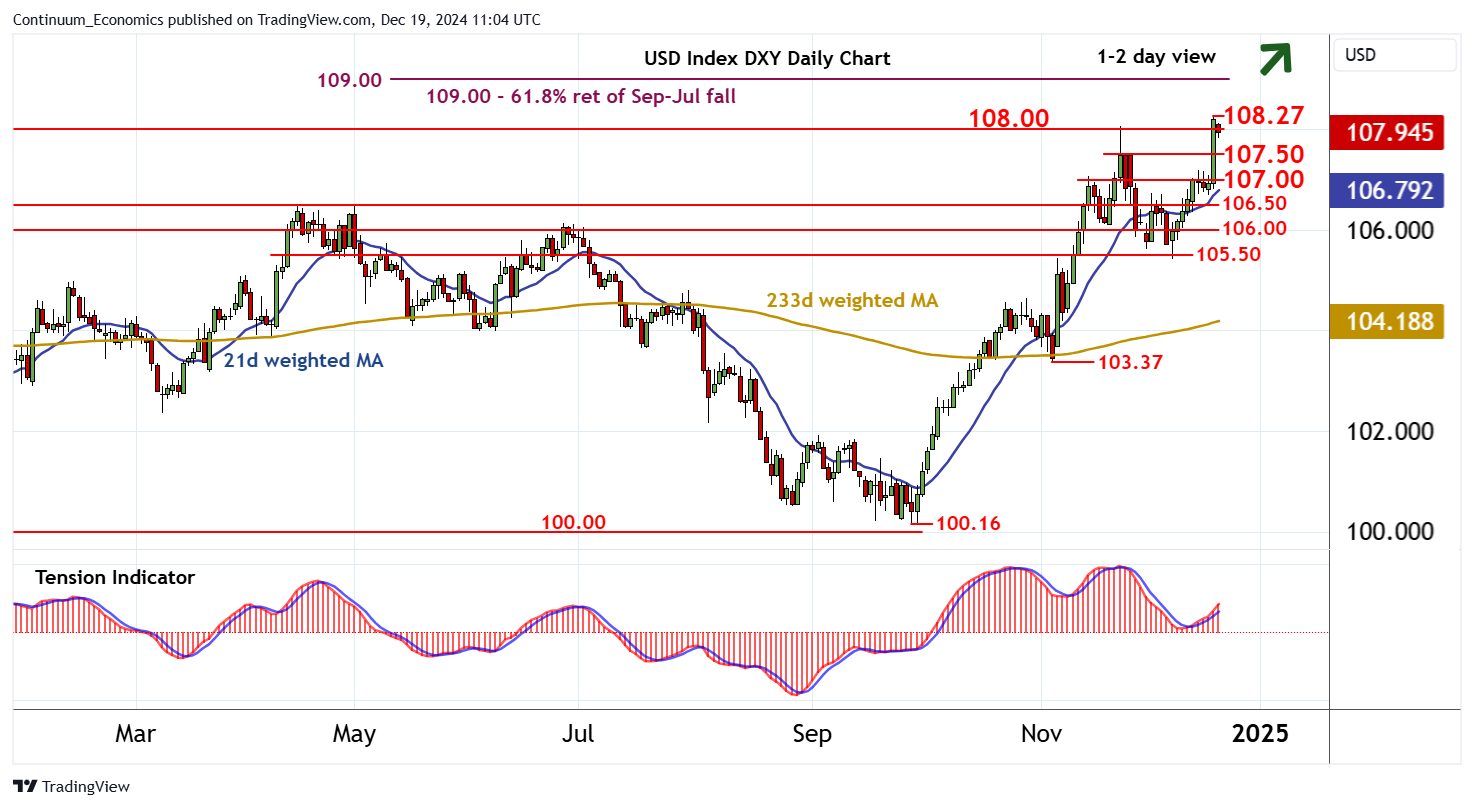
10:45 GMT - Consolidation has given way to a sharp reactive bounce, with prices posting fresh 2024 year highs above 108.00 before settling into cautious trade around 108.00. Intraday studies are unwinding overbought areas and overbought daily stochastics are flattening, suggesting room for a pullback. But the positive daily Tension Indicator and improving weekly charts are expected to limit scope in fresh buying interest/consolidation towards 107.50. Following cautious trade, fresh gains are looked for. But a close above 108.00 and the 108.27 current year high of 18 December is needed to turn sentiment positive and extend July 2023 gains towards strong resistance at the 109.00 Fibonacci retracement.