Published: 2025-11-04T12:41:31.000Z
Chart USD/ZAR Update: Studies improving
1
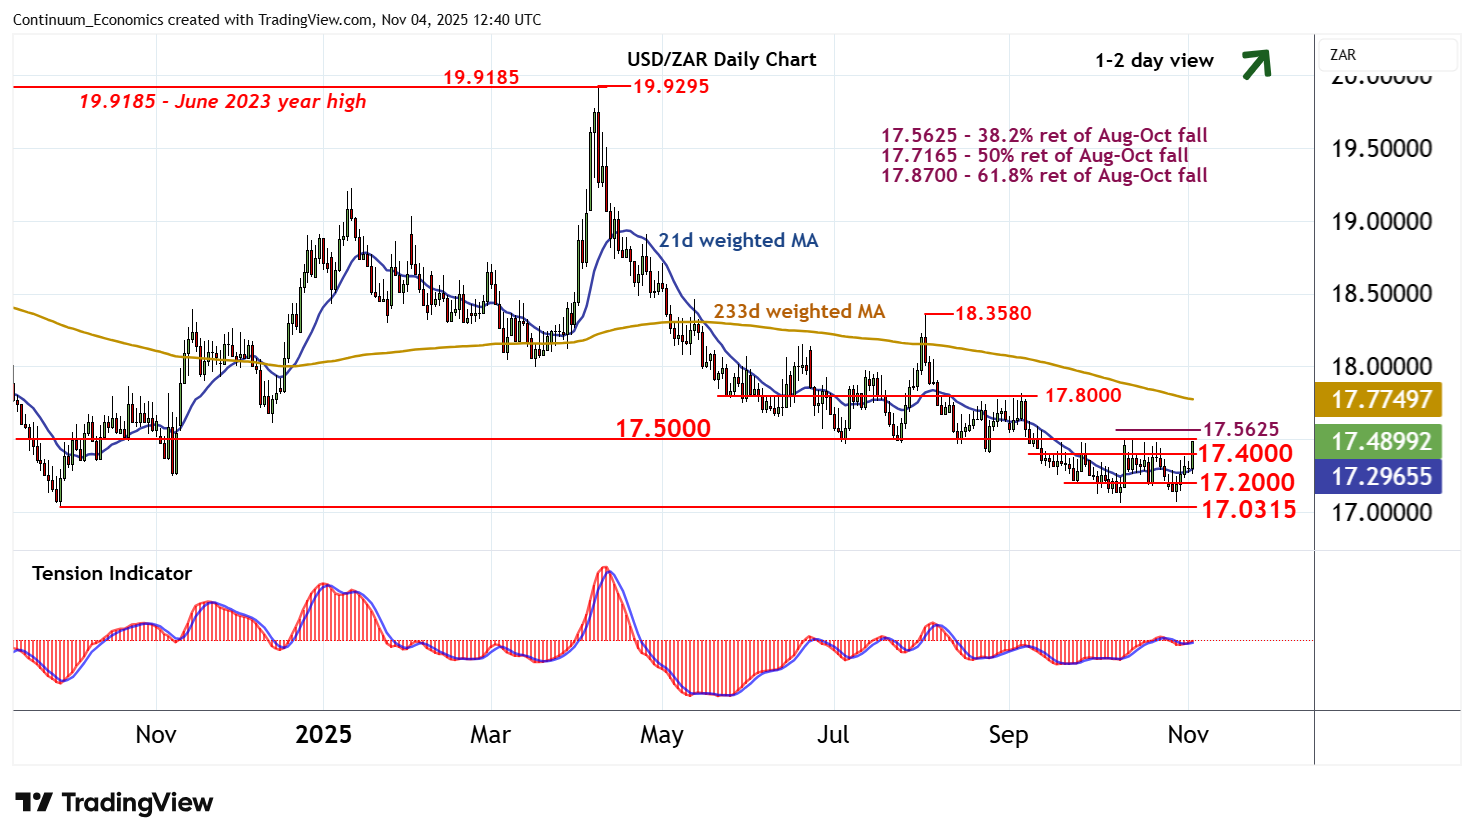
Choppy trade is giving way to a move higher
| Level | Comment | Level | Comment | |||||
|---|---|---|---|---|---|---|---|---|
| R4 | 17.8000 | break level | S1 | 17.2000 | * | congestion | ||
| R3 | 17.5625 | ** | 38.2% ret of Aug-Oct fall | S2 | 17.0630 | * | 9 Oct YTD low | |
| R2 | 17.5000 | ** | congestion | S3 | 17.0315 | ** | 30 Sep 2024 (y) low | |
| R1 | 17.4000 | congestion | S4 | 17.0000 | ** | congestion |
Asterisk denotes strength of level
12:10 GMT - Choppy trade is giving way to a move higher, as intraday studies rise, with prices currently trading within the 17.4000 - 17.5000 resistance. Daily readings have turned higher and broader weekly charts are improving, highlighting room for further strength in the coming sessions. However, a close above the 17.5625 Fibonacci retracement is needed to turn sentiment positive and extend October gains towards 17.8000. Meanwhile, support remains at congestion around 17.2000. But a close below the 17.0315 year low of 30 September 2024 would confirm a deeper correction of the broad 2021-2023 rally, as focus then turns to the 16.6900 monthly low of January 2023.