Published: 2026-02-06T08:27:37.000Z
Chart USD/CAD Update: Retracing Janaury losses
2
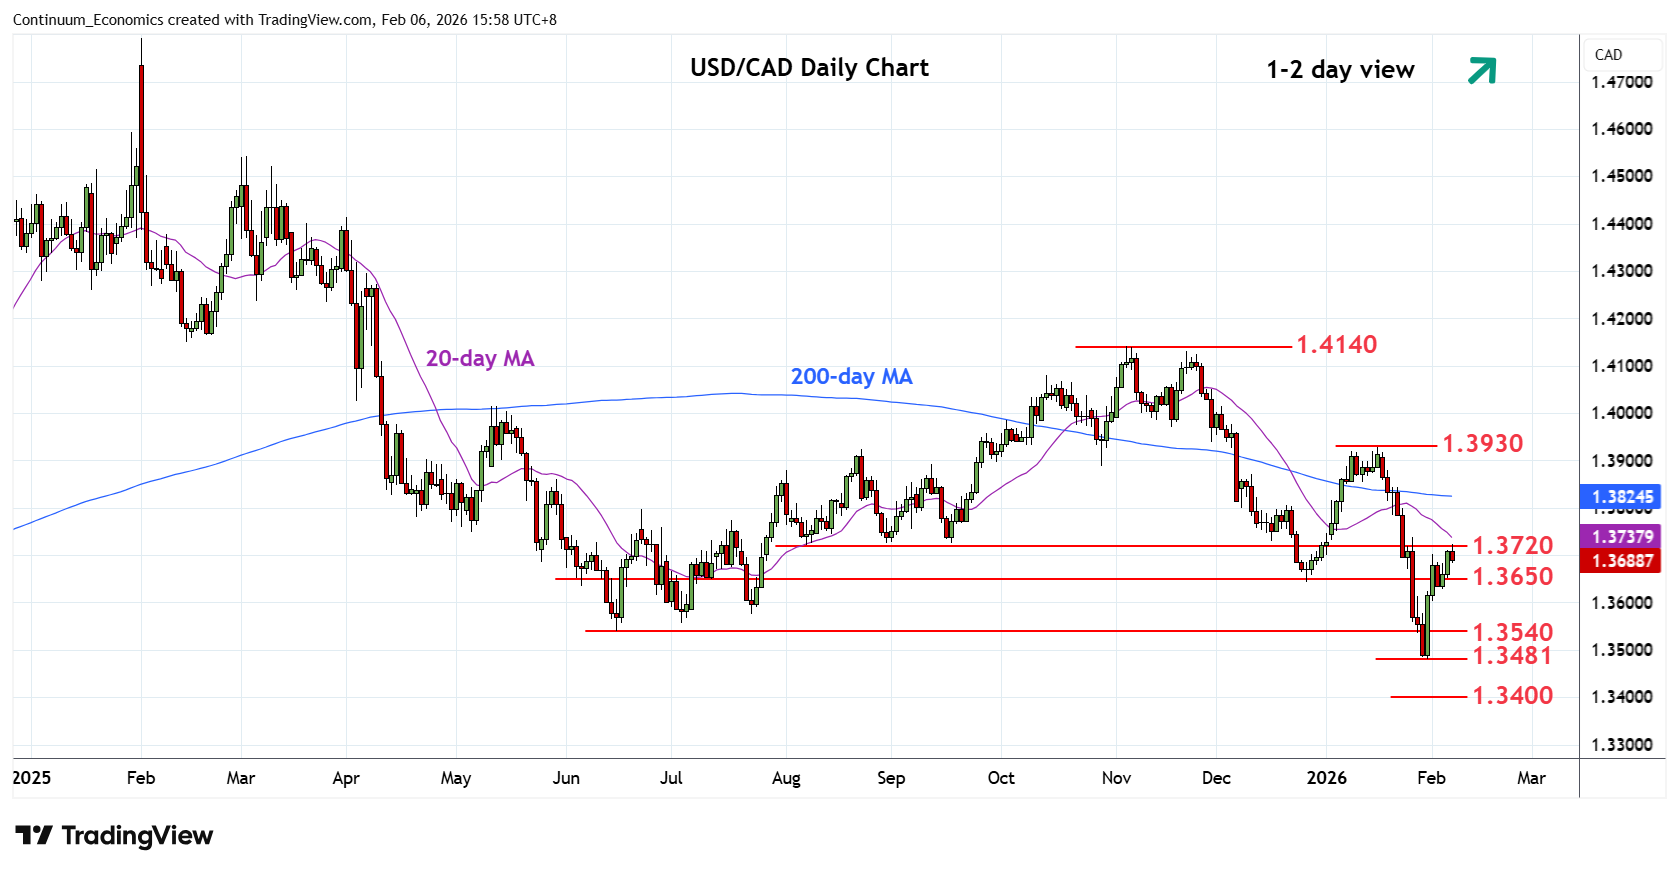
Break above the 1.3700 level has seen extension to resistance at the 1.3720 August low
| Levels | Imp | Comment | Levels | Imp | Comment | |||
|---|---|---|---|---|---|---|---|---|
| R4 | 1.3900/30 | ** | congestion, Jan high | S1 | 1.3650 | congestion | ||
| R3 | 1.3800 | * | congestion | S2 | 1.3600 | * | congestion | |
| R2 | 1.3750/60 | * | congestion, 61.8% | S3 | 1.3540 | * | 16 Jun 2025 year low | |
| R1 | 1.3720 | * | Aug low | S4 | 1.3481 | ** | 30 Jan YTD low |
Asterisk denotes strength of level
08:15 GMT - Break above the 1.3700 level has seen extension to resistance at the 1.3720 August low. Daily studies are tracking higher and suggest scope for break here to further retrace the January losses to the 1.3750/60 resistance and 61.8% Fibonacci level. Corrective gains are expected to give way to selling pressure later with support . Meanwhile, support is raised to the 1.3650 congestion. Break here and the 1.3600 level will return focus to the downside for retest of the 1.3540 and 1.3481, 2025 year low and January YTD low.