Published: 2025-08-04T08:21:48.000Z
Chart USD Index DXY Update: Limited downside tests

Senior Technical Strategist
1
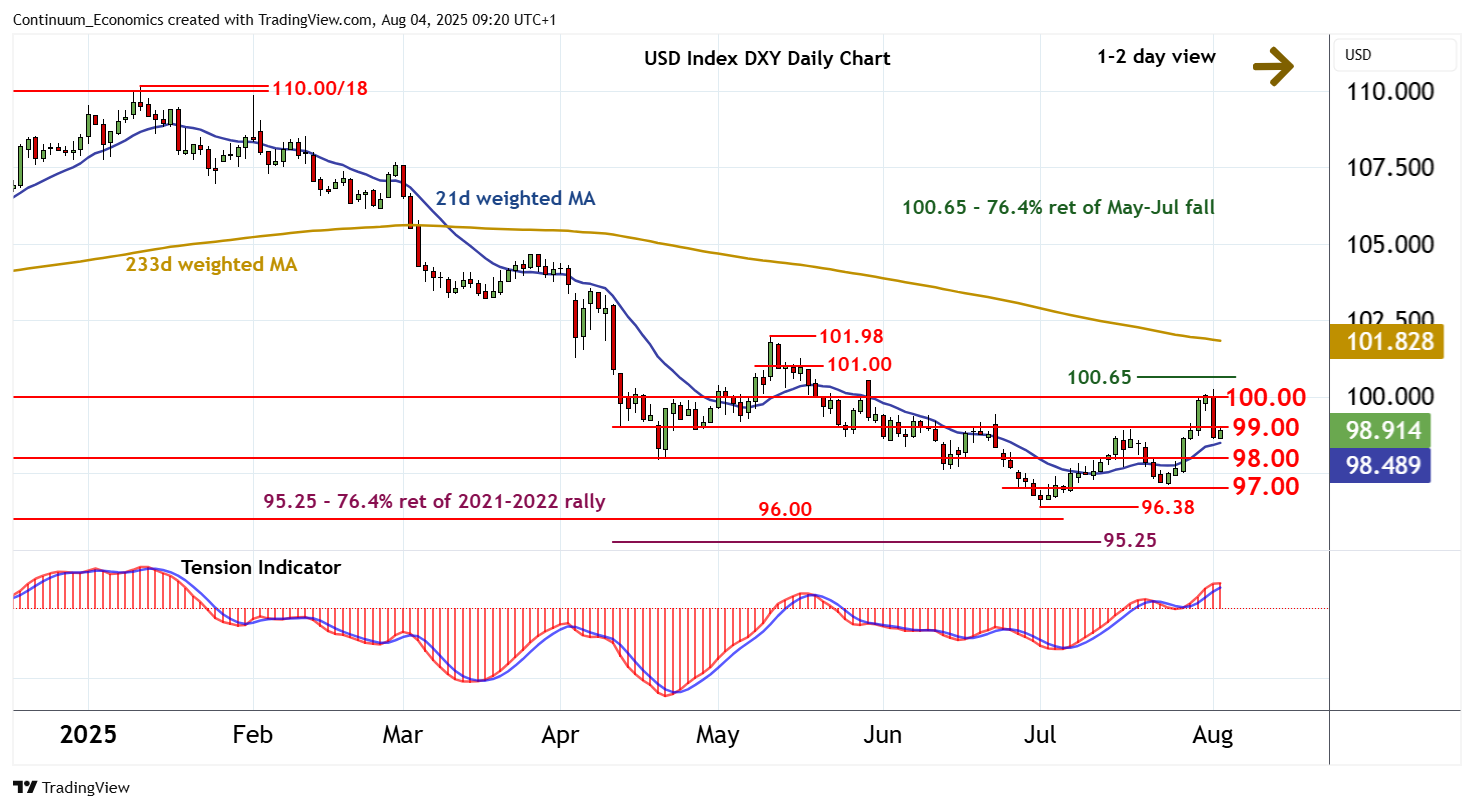
The anticipated break below 99.00 has reached 98.60
| Levels | Imp | Comment | Levels | Imp | Comment | |||
|---|---|---|---|---|---|---|---|---|
| R4 | 100.65 | ** | 76.4% ret of May-Jul fall | S1 | 98.00 | * | congestion | |
| R3 | 100.54 | ** | 29 May (w) high | S2 | 97.00 | * | congestion | |
| R2 | 100.00 | ** | congestion | S3 | 96.50 | congestion | ||
| R1 | 99.00 | * | break level | S4 | 96.38 | ** | 1 Jul YTD low |
Asterisk denotes strength of level
09:05 BST - The anticipated break below 99.00 has reached 98.60, where flat oversold intraday studies are prompting consolidation. Overbought daily stochastics are unwinding and the positive daily Tension Indicator is flattening, suggesting room for further tests lower in the coming sessions. Support is down to congestion around 98.00. But rising weekly charts should limit any initial tests in fresh consolidation. Meanwhile, any tests above resistance at 99.00 should meet fresh selling interest towards congestion around 100.00.