Chart USD/RUB Update: Consolidating
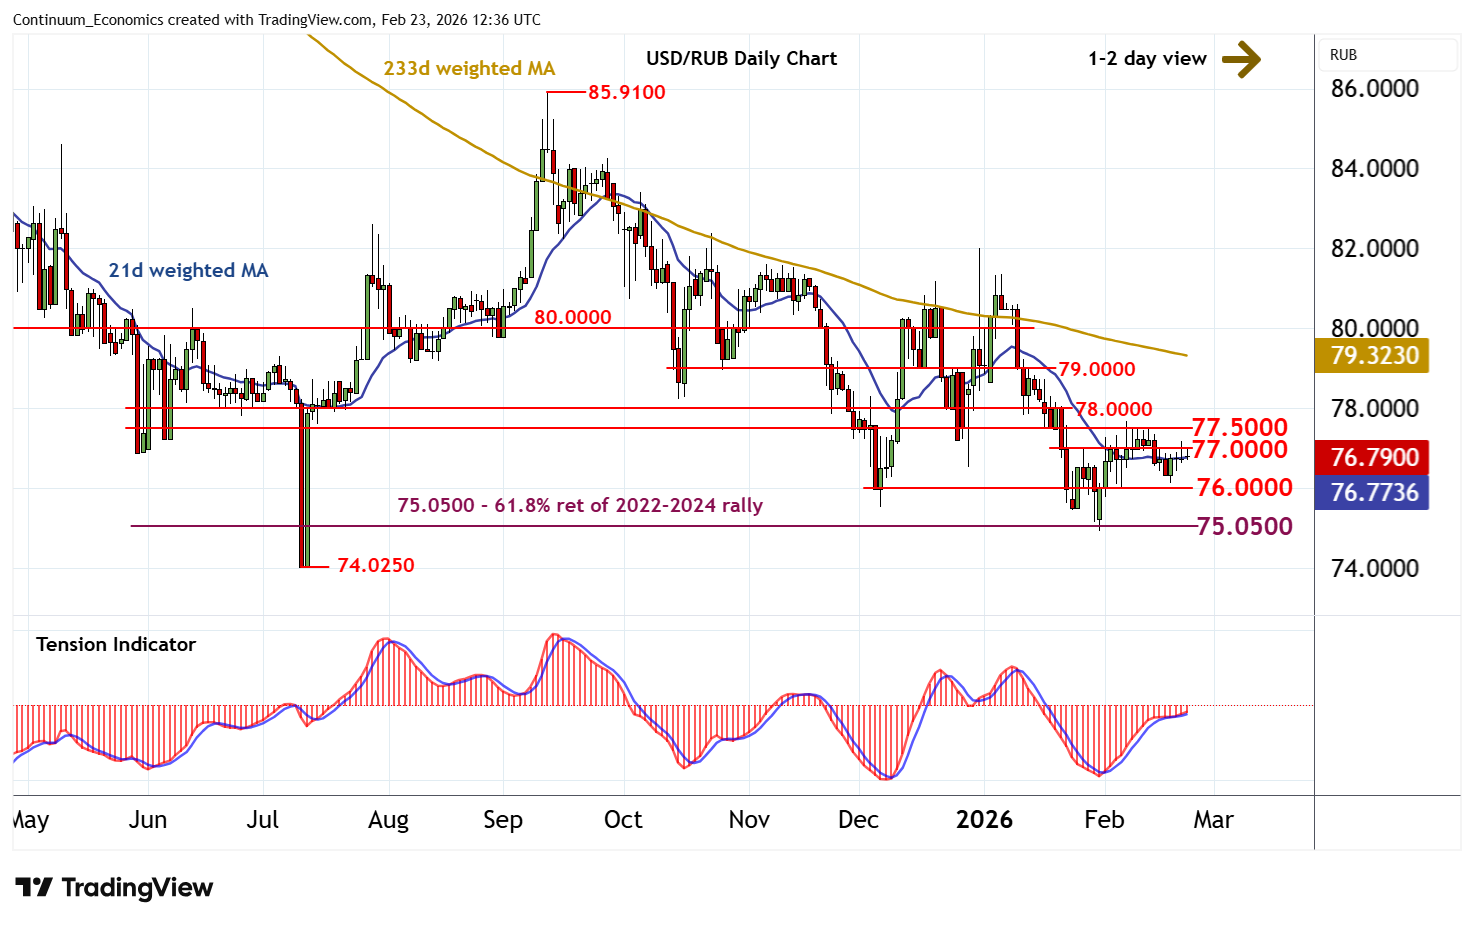
Little change, as prices extend consolidation within the 76.0000 - 77.0000 range
| Levels | Comment | Levels | Comment | |||||
| R4 | 79.0000 | * | break level | S1 | 76.0000 | * | congestion | |
| R3 | 78.0000 | * | break level | S2 | 75.0500 | ** | 61.8% ret of 2022-2024 rally | |
| R2 | 77.5000 | * | congestion | S3 | 74.0250 | ** | 10 July 2025 (y) low | |
| R1 | 77.0000 | * | congestion | S4 | 73.0000 | break level |
Asterisk denotes strength of level
12:25 GMT - Little change, as prices extend consolidation within the 76.0000 - 77.0000 range. The daily Tension Indicator is edging higher, suggesting room for a fresh test above congestion resistance at 77.0000. But flat daily stochastics and mixed weekly charts should limit scope in renewed selling interest towards further congestion around 77.5000. A close above here, however, would improve price action and extend late-January gains towards 78.0000. Meanwhile, support remains at congestion around 76.0000. Following cautious trade, a break beneath here is looked for. Focus will then turn to the 75.0500 Fibonacci retracement. However, a close below critical support at the 74.0250 year low of 10 July is needed to turn sentiment negative and confirm continuation of November 2024 losses.